Relative risk with 95% confidence intervals
Relative risk is calculated in prospective studies
Relative risk with 95% confidence interval is the inferential statistic used in prospective cohort and randomized controlled trials. With relative risk, the width of the confidence interval is the inference related to the precision of the treatment effect.
If relative risk and the confidence interval crosses over 1.0, meaning that the event is just as likely to occur as not occur, then researchers have a non-significant association between the variables.
If relative risk and the confidence interval are both entirely above 1.0, then people are MORE AT RISK of developing the outcome as a result of the treatment or exposure.
If relative risk and the confidence interval are both entirely below 1.0, then people are LESS AT RISK of developing the outcome as a result of treatment or exposure, denoting a "protective" effect.
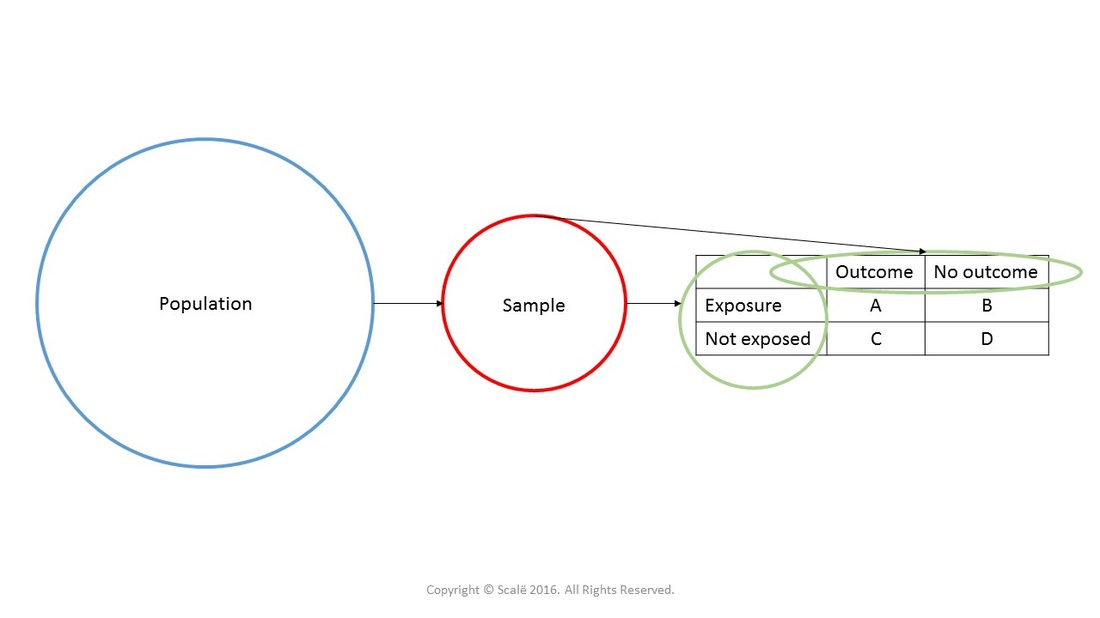
From a research design standpoint, the 2x2 table is used to find associations between an exposure and an outcome.
Research design and the 2x2 table
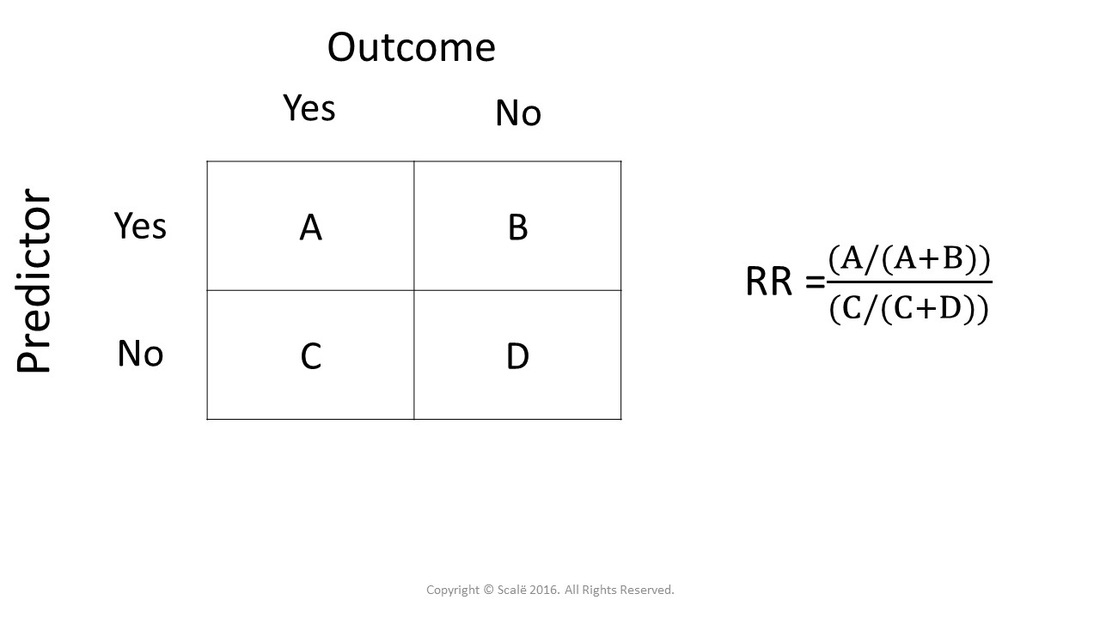
Relative risk calculation
Relative risk is used to establish treatment effects in prospective studies and can generate a measure of incidence, or the number of new cases in a given population. Relative risk is a measure that from both a mathematical and practical standpoint makes more sense to investigators and clinicians. First of all, look at the underlying math associated with the calculation:
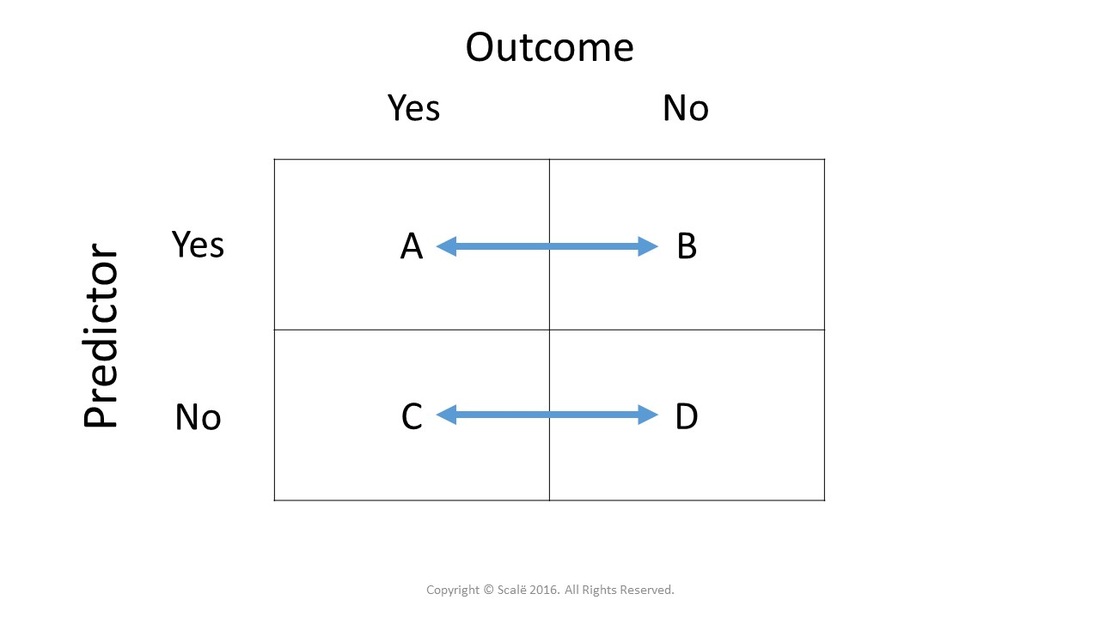
Relative risk is a direct comparison of risk ratios
In comparison to the calculations for odds ratios, you can see here that the underlying mathematical reasoning of relative risk does not "cross-over" into other levels of exposure, but instead provides an actual comparison of risk ratios between independent groups.
Click on the Incidence button to continue. Click on the Download Database button for a database structured for relative risk data.
Hire A Statistician
DO YOU NEED TO HIRE A STATISTICIAN?
Eric Heidel, Ph.D., PStat will provide you with statistical consultation services for your research project at $100/hour. Secure checkout is available with Stripe, Venmo, Zelle, or PayPal.
- Statistical Analysis on any kind of project
- Dissertation and Thesis Projects
- DNP Capstone Projects
- Clinical Trials
- Analysis of Survey Data


