Unadjusted odds ratio
Compare three or more independent groups on a dichotomous categorical outcome
Unadjusted odds ratios using a reference category are the best inference when comparing three or more independent groups on a dichotomous categorical outcome. If researchers are testing three or more independent groups on a dichotomous categorical outcome, set one of the groups as the reference category and run separate unadjusted odds ratios for each group compared to the reference group. Report the unadjusted odds ratios with their respective 95% confidence intervals.
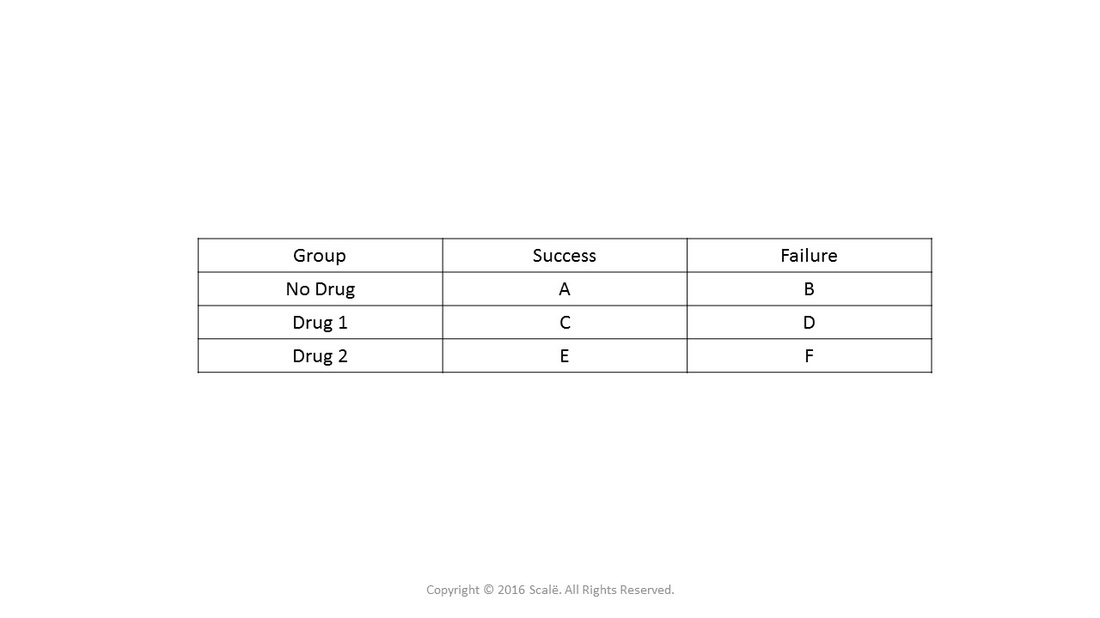
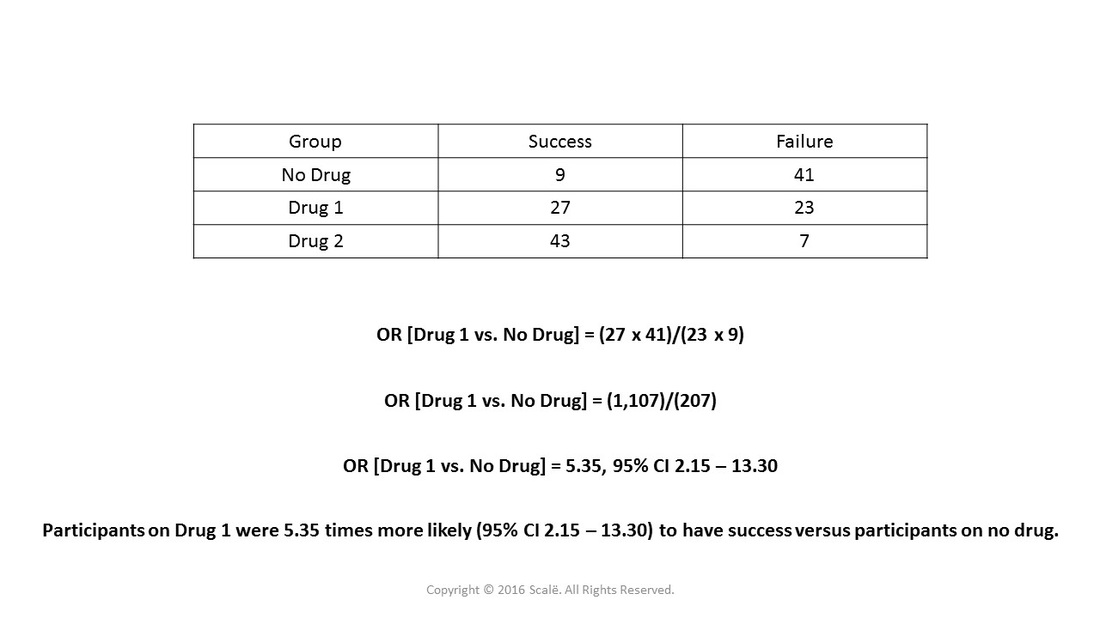
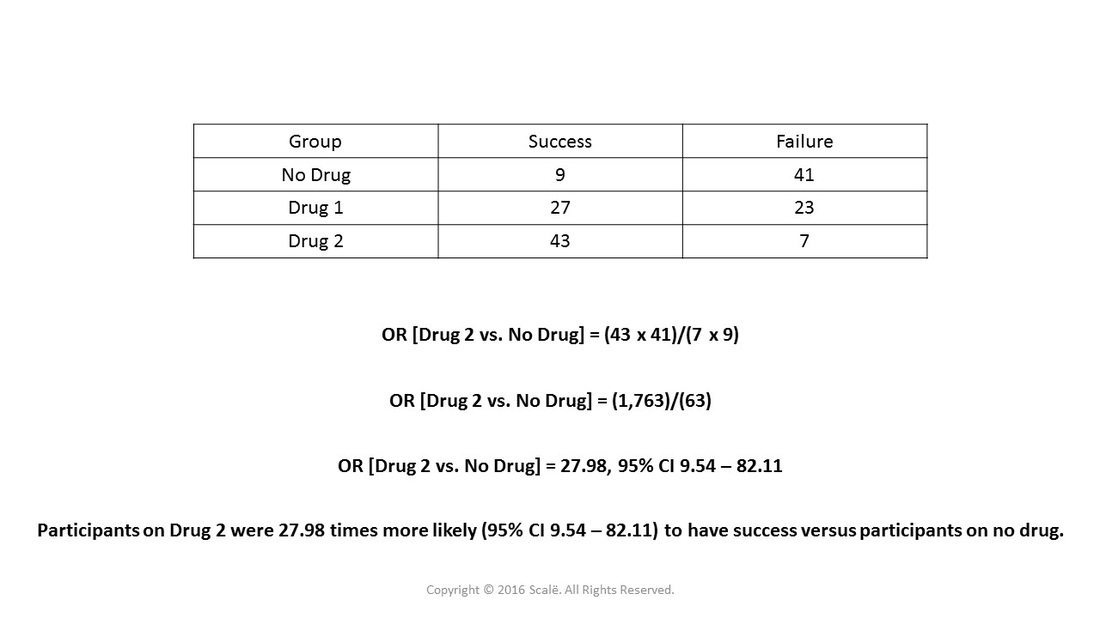
For example, let's say that researchers have three independent groups, 50 participants that received no drug, 50 participants that received a drug (Drug 1), and 50 participants that received another drug (Drug 2). Researchers want to know if there are any differences between the groups in terms of successful treatment. Here is how to set up the table:
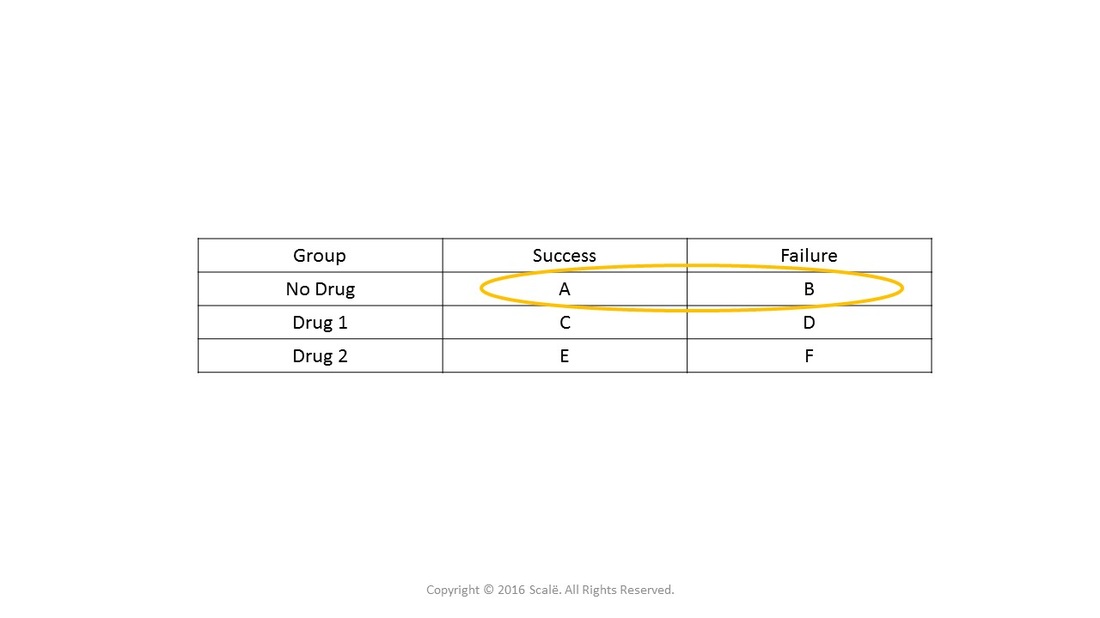
Researchers have to choose a reference category when there are more than two levels in a categorical variable. Here, "No drug" is the reference.
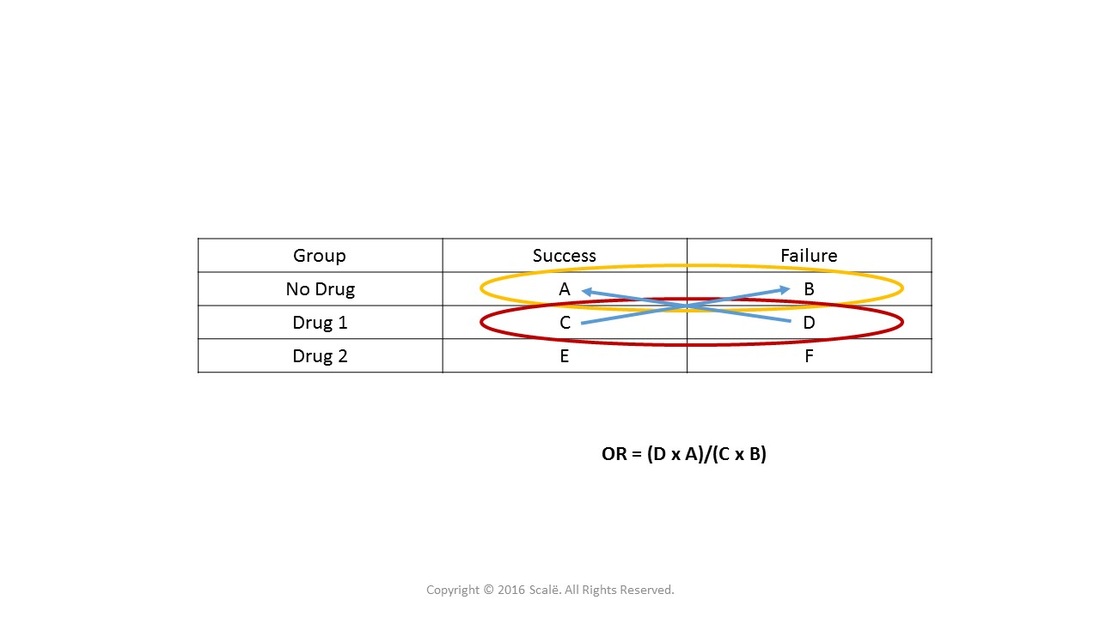
This figure shows the first part of the analysis where a category is compared to the reference category. Here, "Drug 1" is being compared to the reference category, "no drug."
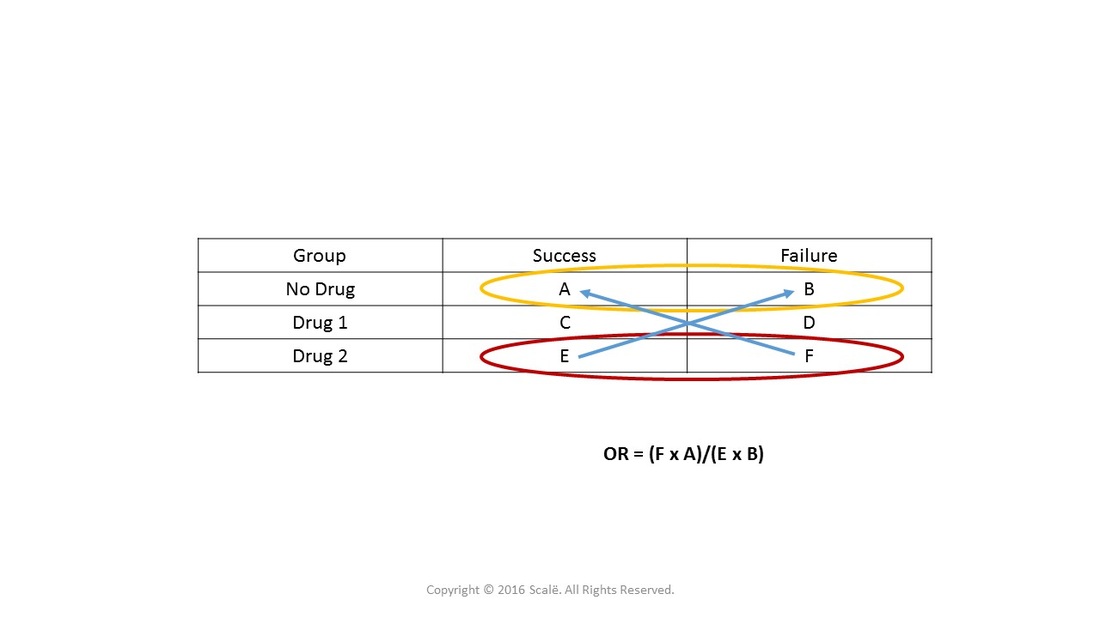
This figure depicts the second part of the analysis where the other category is compared to the reference category. "Drug 2" is being compared to the reference category, "no drug."
This figure depicts the first calculation of the hypothetical data for "Drug 1" vs. "No Drug," the reference category.
This figure depicts the second calculation with the hypothetical data for "Drug 2" vs. "No Drug," the reference category.
Luckily, there is a very simple way in SPSS to conduct this analysis using logistic regression. Make sure to designate the reference category as a "0" and have the outcome variable set as nominal in Variable View.
The steps for conducting an unadjusted odds ratio in SPSS
1. The data is entered in a between-subjects fashion.
2. Click Analyze.
3. Drag the cursor over the Regression drop-down menu.
4. Click Binary Logistic.
5. Click on the dichotomous categorical outcome variable to highlight it.
6. Click on the arrow to move the variable into the Dependent: box.
7. Click on the polychotomous categorical predictor variable to highlight it.
8. Click on the arrow to move the variable into the Covariates: box.
9. Click on the Categorical button.
10. Click on the predictor variable in the Covariates: box to highlight it.
11. Click on the arrow to move the variable into the Categorical Covariates: box.
12. Click on the Reference Category: First marker to select it.
13. Click on the Change button.
14. Click Continue.
15. Click on the Options button.
16. Click on the CI for exp(B): box to select it.
17. Click Continue.
18. Click OK.
The steps for interpreting the SPSS output for an unadjusted odds ratio
1. Scroll all the way down to the bottom of the output, until the Variables in the Equation table.
2. Look under the first column of the table to find the name of the predictor variable. In the second row, the name will have a (1) beside it. This is the independent group or level of the categorical variable that is one unit more than what has been codified as the reference category.
This is why it is important to codify the reference category as "0." The SPSS outputs assign these values to multivariate analyses and interpretation can become cumbersome when one is not aware of this formatting issue. For example, if researchers designate the reference category as "1," then the variable in the second row of the table with a (1) in the name is not Group 1, but Group 2. The variable in the third row with a (2) is not Group 2, but Group 3. So, just to make things easier, please codify reference category as "0." It is SO much easier to interpret!
3. In the Exp(B) column, interpret the unadjusted odds ratios for each group or independent level when compared to the reference category.
4. Under the 95% C.I. for EXP(B) column heading, one can find the Lower and Upper limits of the 95% confidence interval for each unadjusted odds ratio.
5. There is no need to report a p-value with this type of statistic. The 95% confidence interval of the odds ratio is the primary inferential statistic for interpretation.
Click on the Download Database and Download Data Dictionary buttons for a configured database and data dictionary for an unadjusted odds ratio. Click on the Adjusting for Multiple Comparisons button to learn more about Bonferroni, Tukey's HSD, and Scheffe's test. Click on the Validation of Statistical Findings button to learn more about bootstrap, split-group, and jack-knife validation methods.
Hire A Statistician
DO YOU NEED TO HIRE A STATISTICIAN?
Eric Heidel, Ph.D., PStat will provide you with statistical consultation services for your research project at $100/hour. Secure checkout is available with Stripe, Venmo, Zelle, or PayPal.
- Statistical Analysis on any kind of project
- Dissertation and Thesis Projects
- DNP Capstone Projects
- Clinical Trials
- Analysis of Survey Data
