Systematic review
A systematic review yields pooled effects
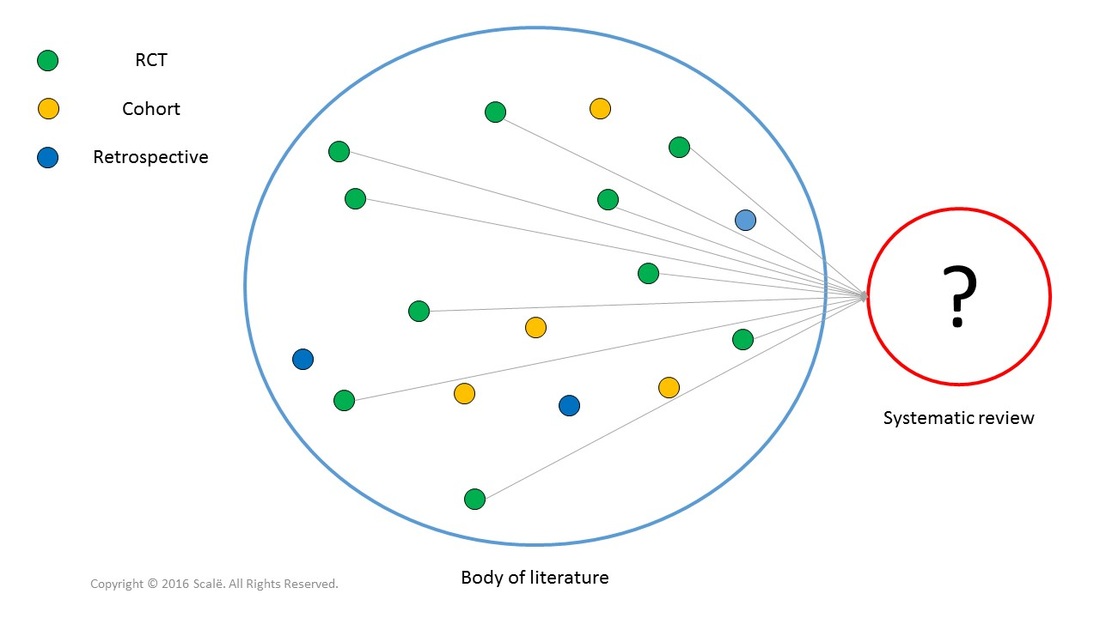
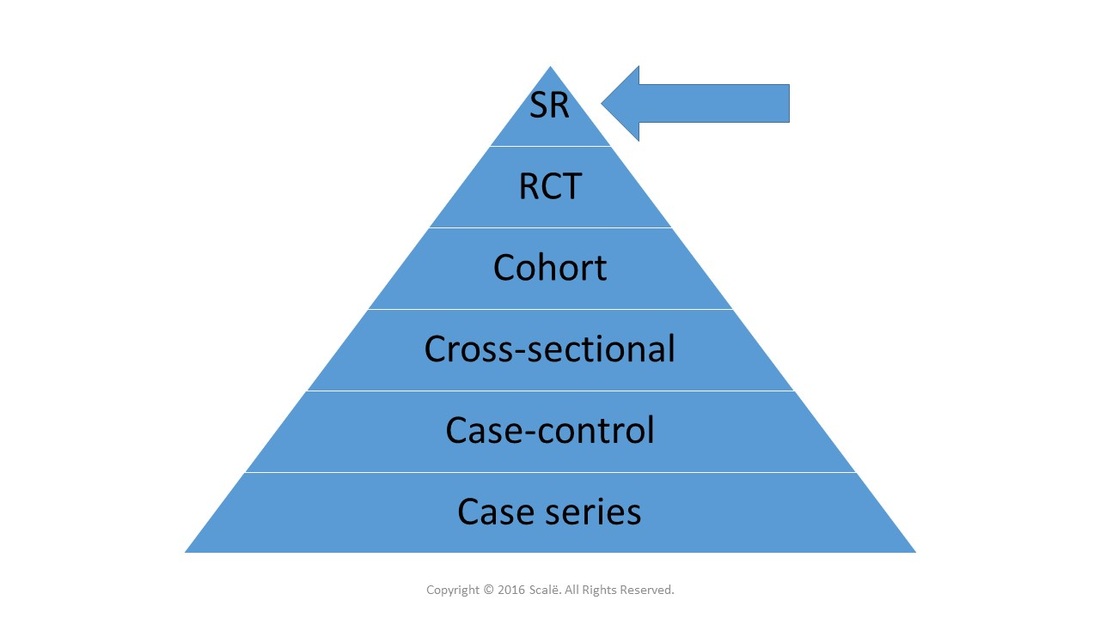
Systematic reviews yield the highest level of clinical evidence by aggregating the findings of multiple studies into one pooled effect. The statistic used for systematic reviews is a called a meta-analysis. Systematic review and meta-analysis are often used interchangeably but systematic review is the research design and meta-analysis is the statistical test used.
The most important part of conducting systematic reviews constitutes the effort put forth by the researchers to search for all of the relevant literature that exists within accessible databases, paper publications, unpublished studies, and even studies in foreign languages. Going further, once a thorough literature search has been conducted, an even more objective and methodologically sound effort must be made by the researchers to assess the quality, validity, and generalizability of individual study methods and results for inclusion in the systematic review. The inclusion and exclusion criteria for individual studies in a systematic review must be operationally defined in an overt and explicit fashion.
The most important part of conducting systematic reviews constitutes the effort put forth by the researchers to search for all of the relevant literature that exists within accessible databases, paper publications, unpublished studies, and even studies in foreign languages. Going further, once a thorough literature search has been conducted, an even more objective and methodologically sound effort must be made by the researchers to assess the quality, validity, and generalizability of individual study methods and results for inclusion in the systematic review. The inclusion and exclusion criteria for individual studies in a systematic review must be operationally defined in an overt and explicit fashion.
To reduce bias in a meta-analysis, it is important to only include one type of design (observational or experimental) in the analysis. If you plan on integrating high quality observational evidence into your analysis, it is best to run mutually exclusive meta-analyses with observational and experimental studies separated because of the inherent bias that is introduced by observational studies.
When the findings of several quality RCTs are aggregated in a meta-analysis, a much more precise estimate of the treatment effect can be generated due to increased sample size and representation of the population. Subgroup analyses or "sensitivity analyses" can be conducted with the large aggregated population brought together across studies in a systematic review.
When the findings of several quality RCTs are aggregated in a meta-analysis, a much more precise estimate of the treatment effect can be generated due to increased sample size and representation of the population. Subgroup analyses or "sensitivity analyses" can be conducted with the large aggregated population brought together across studies in a systematic review.
When the results of several high quality RCTs have been aggregated and appraised, systematic reviews yield pooled effects based on much larger and diverse samples of the population.
Forest plot and heterogeneity of pooled effect in a systematic review
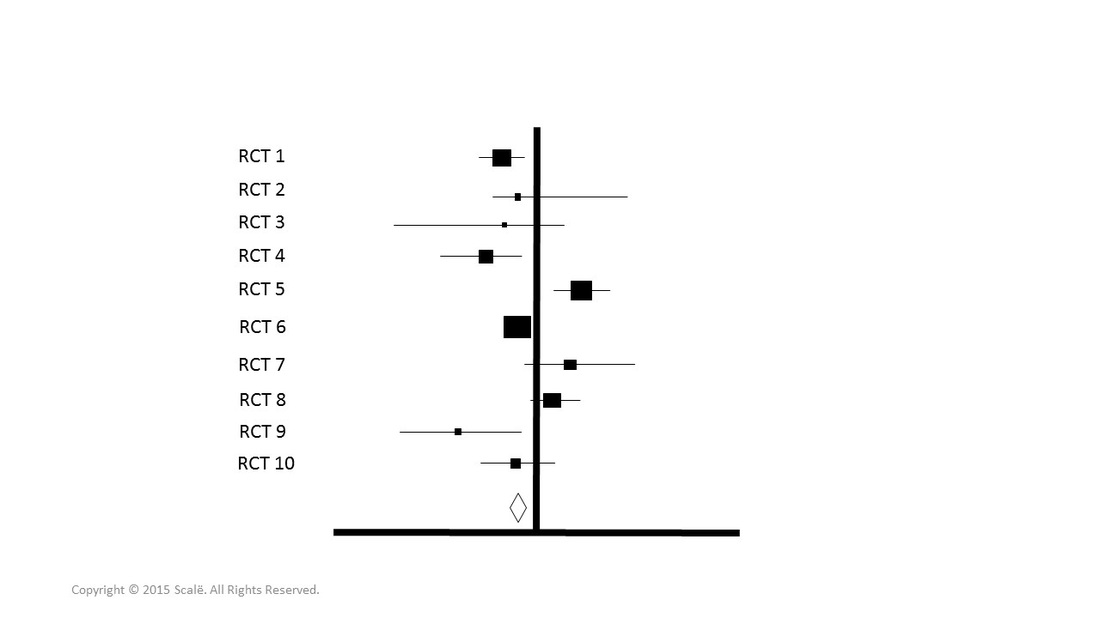
The results of meta-analyses are often reported using a forest plot. The forest plot presents the findings of individual studies in regards to measures of risk and confidence intervals. The findings for each study are combined into an overall measure of effect that is indicative of the entire population represented in each respective published paper.
The I2 statistic is a measure of heterogeneity amongst the studies' findings which may artificially inflate or deflate the pooled effect. As a general criterion, < 25% is low heterogeneity, < 50% is moderate, and < 75% is considered high heterogeneity. With high values of I2, the ability to appropriately interpret the pooled effect decreases. Sensitivity analyses or subgroup analyses should be conducted to account for high levels of heterogeneity.
Forest plots will often look like the diagram below. Notice that RCTs with smaller squares (small sample sizes) have wider confidence intervals and trials with larger squares (larger sample sizes) have small confidence intervals and weigh more on the pooled effect. The diamond is the pooled effect.
Funnel plots and systematic reviews
Funnel plots are used to assess the amount of publication bias associated with the trials that are used in the meta-analysis. Symmetrical distributions show evidence of decreased publication bias. Asymmetrical funnel plot findings show evidence of increased publication bias.
The steps for conducting a meta-analysis
- The research question is created using the FINER and PICO frameworks and a systematic review should be used to answer the research question.
- The inclusion and exclusion criteria are explicitly defined and the literature search is carried out across a wide spectrum of relevant sources of evidence.
- The studies from the literature search are individually assessed in an independent fashion for inclusion into the systematic review.
- The results of the studies that meet inclusion criteria are reviewed and the measures of odds, risk, or treatment effects are recorded.
- Publication bias is assessed using a funnel plot.
- Sensitivity analyses are conducted as needed for research questions related to existing subgroups from the population of interest.
- A meta-analysis, the statistical test used for systematic reviews, is performed and the results are reported in a forest plot.
- The pooled effect is interpreted.
- The heterogeneity of the pooled effect is assessed using the I2 statistic.
Click on a button below to continue.
Statistician For Hire
DO YOU NEED TO HIRE A STATISTICIAN?
Eric Heidel, Ph.D. will provide statistical consulting for your research study at $100/hour. Secure checkout is available with PayPal, Stripe, Venmo, and Zelle.
- Statistical Analysis
- Sample Size Calculations
- Diagnostic Testing and Epidemiological Calculations
- Psychometrics


