Pearson's r
Correlation between two continuous variables
Pearson's r correlation is used to assess the relationship between two continuous variables. Pearson's r is the most popular correlation test. Pearson's r should not be run on data that has outliers. Before running a Pearson's r, be sure to check for the normality of the two continuous variables using skewness and kurtosis statistics. Outliers can grossly inflate or deflate a Pearson r correlation. The coefficient of determination is calculated as a measure of effect size for Pearson's r correlation and is simply the r value, squared.
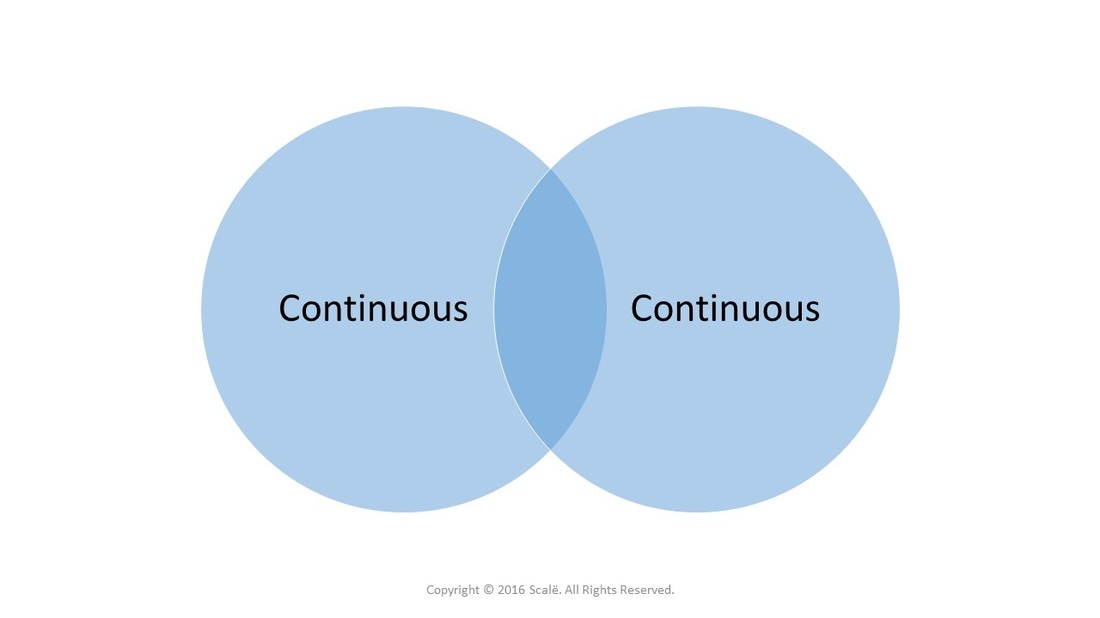
The Venn diagram below depicts the correlation of two continuous variables. Pearson's r is the correlation test used when testing the relationship between two continuous variables.
The steps for conducting a Pearson's r correlation in SPSS
1. The data is entered in a within-subjects fashion.
2. Click Analyze.
3. Drag the cursor over the Correlate drop-down menu.
4. Click on Bivariate.
5. Click on the first continuous outcome variable to highlight it.
6. Click on the arrow to move the variable into the Variables: box.
7. Click on the second continuous outcome variable to highlight it.
8. Click on the arrow to move the variable into the Variables: box.
9. Click OK.
The steps for interpreting the SPSS output for a Pearson's r correlation
1. In the Correlations table, match the row to the column between the two continuous variables. The Pearson Correlation is the actual correlation value that denotes magnitude and direction, the Sig. (2-tailed) is the p-value that is interpreted, and the N is the number of observations that were correlated.
If the p-value is LESS THAN .05, then researchers have evidence of a statistically significant bivariate association between the two continuous variables.
If the p-value is MORE THAN .05, then researchers have evidence that there is not a statistically significant association between the two continuous variables.
Higher r coefficients denote a stronger magnitude of relationship between variables. Smaller r coefficients denote weaker relationships.
Positive correlations denote a relationship that travels at the same trajectory. As one value goes up, then the other value goes up. Also, as one value goes down, then the other value goes down too.
Negative correlations denote a relationship that travels in different directions. As one value goes up, the other value goes down. Also, as one value goes down, then the other value goes up.
Click on the Download Database and Download Data Dictionary buttons for a configured database and data dictionary for Pearson's r correlation. Click on the Adjusing for Multiple Comparisons button to learn more about Bonferroni, Tukey's HSD, and Scheffe's test. Click on the Validation of Statistical Findings button to learn more about bootstrap, split-group, and jack-knife validation methods.
Statistician For Hire
DO YOU NEED TO HIRE A STATISTICIAN?
Eric Heidel, Ph.D. will provide statistical consulting for your research study at $100/hour. Secure checkout is available with PayPal, Stripe, Venmo, and Zelle.
- Statistical Analysis
- Sample Size Calculations
- Diagnostic Testing and Epidemiological Calculations
- Psychometrics

