The Kruskal-Wallis test is used to answer research questions that compare three or more independent groups on an ordinal outcome. The Kruskal-Wallis test is considered non-parametric because the outcome is not measured at a continuous level. Instead of reporting means and standard deviations, researchers will report the median and interquartile range of each group when using a Kruskal-Wallis test.
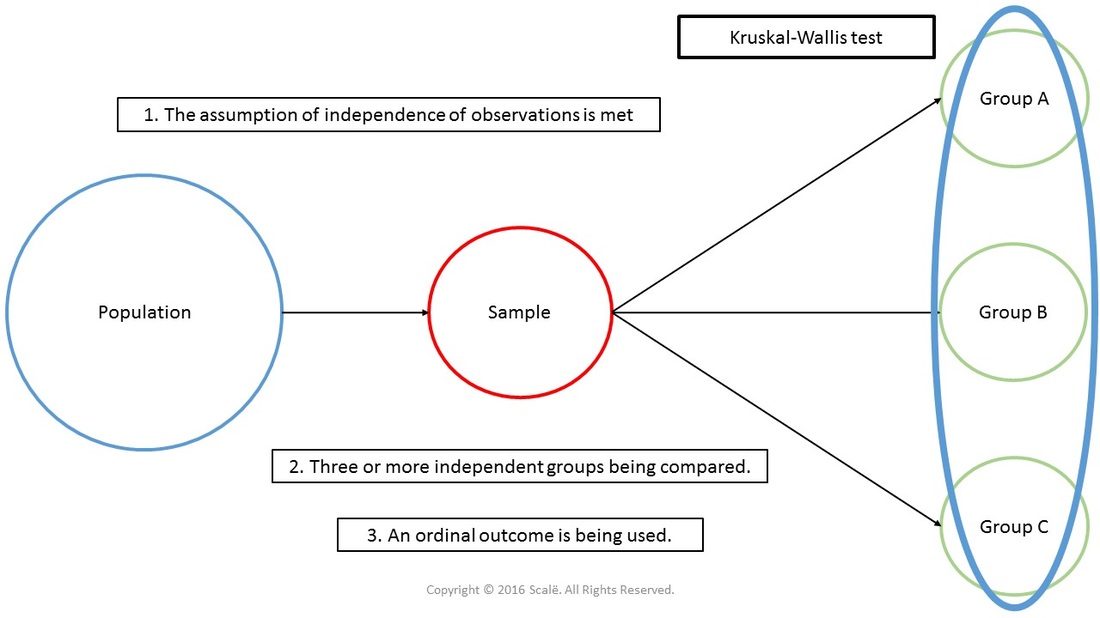
This figure depicts the use of a Kruskal-Wallis test. The assumption of independence of observations has been met, there are three or more independent groups being compared in a between-subjects fashion, and an ordinal outcome is being used.

1. The data is entered in a between-subjects fashion.
2. Click Analyze.
3. Drag the cursor over the Nonparametric Tests drop-down menu.
4. Drag the cursor over the Legacy Dialogs drop-down menu.
5. Click K Independent Samples.
6. Click on the continuous outcome variable to highlight it.
7. Click on the arrow button to move the outcome variable into the Test Variable List: box.
8. Click on the "grouping" variable to highlight it and then click on the arrow to move the "grouping" variable into the Grouping Variable: box.
9. Click on the Define Range button.
10. Enter the categorical value for the independent group that has the smallest value into the Minimum: box. Example: "0"
11. Enter the categorical value for the independent group that has the largest value into the Maximum: box. Example: "2"
12. Click Continue.
13. Click OK.
1. In the Test Statistics table, look at the p-value associated with Asymp. Sig. row. This is the p-value that is interpreted.
If it is LESS THAN .05, then researchers have evidence of a statistically significant difference in the continuous outcome variable between the two independent groups.
If the p-value is MORE THAN .05, then researchers have evidence that there is not a statistically significant difference in the continuous outcome variable between the two independent groups.
If researchers find a significant main effect, or p-value below .05, then they will need to run subsequent Mann-Whitney U tests to test for pairwise comparisons in a post hoc fashion.
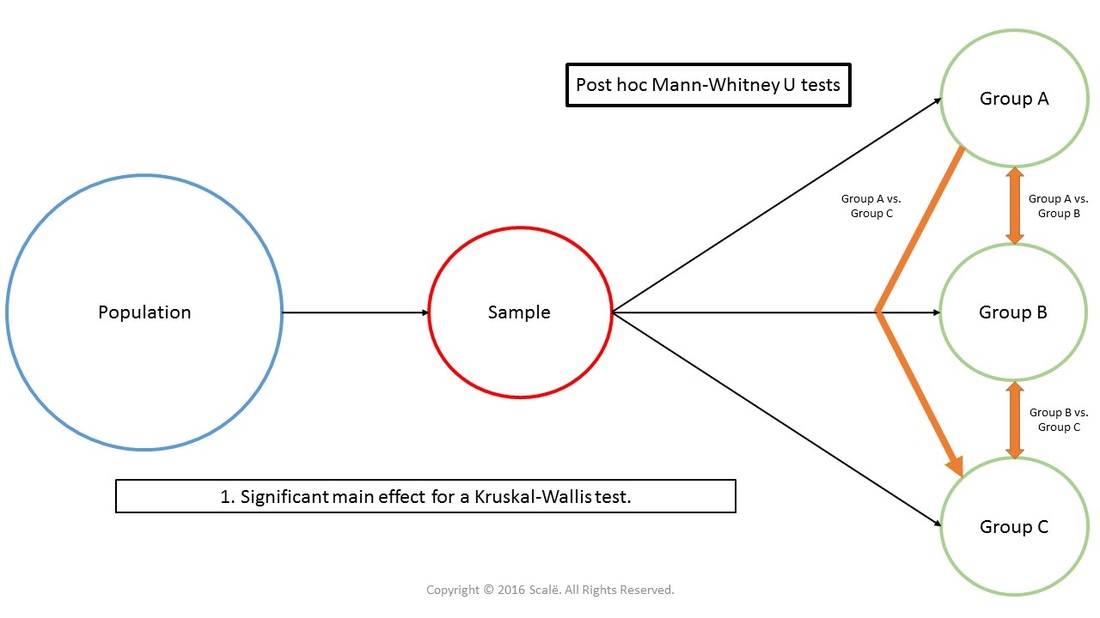
This figure depicts Mann-Whitney U tests being used in a post hoc fashion to explain a significant main effect found with a Kruskal-Wallis test.

1. The data is entered in a between-subjects fashion.
2. Click Analyze.
3. Drag the cursor over the Nonparametric Tests drop-down menu.
4. Drag the cursor over the Legacy Dialogs drop-down menu.
5. Click 2 Independent Samples.
6. Click on the continuous outcome variable to highlight it.
7. Click on the arrow button to move your outcome variable into the Test Variable List: box.
8. Click on the "grouping" variable to highlight it and then click on the arrow to move the "grouping" variable into the Grouping Variable: box.
9. Click on the Define Groups button.
10. Enter the categorical value for the first independent group into the Group 1: box. Example: "0"
11. Enter the categorical value for the second independent group into the Group 2: box. Example: "1"
12. Click Continue.
13. Click OK.
14. Click Analyze.
15. Drag the cursor over the Nonparametric Tests drop-down menu.
16. Drag the cursor over the Legacy Dialogs drop-down menu.
17. Click 2 Independent Samples.
18. Click on the continuous outcome variable to highlight it.
19. Click on the arrow button to move the outcome variable into the Test Variable List: box.
20. Click on the "grouping" variable to highlight it and then click on the arrow to move the "grouping" variable into the Grouping Variable: box.
21. Click on the Define Groups button.
22. Enter the categorical value for the first independent group into the Group 1: box. Example: "0"
23. Enter the categorical value for the third independent group into the Group 2: box. Example: "2"
24. Click Continue.
25. Click OK.
26. Click Analyze.
27. Drag the cursor over the Nonparametric Tests drop-down menu.
28. Drag the cursor over the Legacy Dialogs drop-down menu.
29. Click 2 Independent Samples.
30. Click on the continuous outcome variable to highlight it.
31. Click on the arrow button to move the outcome variable into the Test Variable List: box.
32. Click on the "grouping" variable to highlight it and then click on the arrow to move the "grouping" variable into the Grouping Variable: box.
33. Click on the Define Groups button.
34. Enter the categorical value for the second independent group into the Group 1: box. Example: "1"
35. Enter the categorical value for the third independent group into the Group 2: box. Example: "2"
36. Click Continue.
37. Click OK.
1. In the Test Statistics table for each subsequent Mann-Whitney U analysis, look at the p-value associated with Asymp. Sig. (2-tailed) row. These are the p-values that will be interpreted.
If a p-value is LESS THAN .05, then researchers have evidence of a statistically significant difference in the continuous outcome variable between those two independent groups.
If a p-value is MORE THAN .05, then researchers have evidence that there is not a statistically significant difference in the continuous outcome variable between those two independent groups.
Click on the Download Database and Download Data Dictionary buttons for a configured database and data dictionary for a Kruskal-Wallis test. Click on the Adjusting of Multiple Comparisons button to learn more about Bonferroni, Tukey's HSD, and Scheffe's test. Click on the Validation of Statistical Findings button to learn more about bootstrap, split-group, and jack-knife validation methods.