Chi-square
Chi-square yields an unadjusted odds ratio with 95% confidence interval
When looking at the association between two independent dichotomous categorical variables, the Chi-square test and Fisher's Exact test can be used to generate a traditional p-value that ascertains if the dispersal of the levels of the predictor across levels of the outcome variable are significantly different from what is expected. However, within applied statistics, the chi-square p-value is of little value because of the loss of precision, accuracy, and variance that comes with categorical variables. What applied empiricists and clinicians use instead of the p-value for a chi-square is called the unadjusted odds ratio with 95% confidence interval.
The width of the confidence interval is entirely dependent upon the sample size. The confidence interval is the best inference that can be derived from chi-square analysis. Larger samples will yield more precise and accurate measures of effect. Smaller samples will generate wider confidence intervals. Fisher's Exact test is employed instead of chi-square when there are less than 5 observations in any of the four cells of the 2x2 table or with sample sizes of less than 20 participants (n = 20).
The width of the confidence interval is entirely dependent upon the sample size. The confidence interval is the best inference that can be derived from chi-square analysis. Larger samples will yield more precise and accurate measures of effect. Smaller samples will generate wider confidence intervals. Fisher's Exact test is employed instead of chi-square when there are less than 5 observations in any of the four cells of the 2x2 table or with sample sizes of less than 20 participants (n = 20).
If the 95% confidence interval crosses over 1.0, then the chances of an event occurring are just as likely as it not occurring.
Odds ratios higher than 1.0 that have a confidence interval that does not cross over 1.0 can be interpreted as meaning that the outcome is that many more times likely to occur versus the comparison group.
Odds ratios that are lower than 1.0 and have confidence intervals that cross over 1.0 are considered "protective effects," meaning that the outcome is less likely to occur versus the comparison group.
In every 2x2 table testing the association between two dichotomous categorical variables, there are FOUR potential research questions. The research question for every 2x2 table is based on what group*outcome question is formatted into Cell A of the table. So, here are the four questions that we can ask:
1. What are the odds of exposure versus non-exposure causing the outcome?
2. What are the odds of non-exposure versus exposure causing the outcome?
3. What are the odds of exposure versus non-exposure NOT causing the outcome?
4. What are the odds of non-exposure versus exposure NOT causing the outcome?
So, when structuring your 2x2 table for unadjusted odds ratios, make sure that you have the data set up to answer your research question by having it located in Cell A of the table.
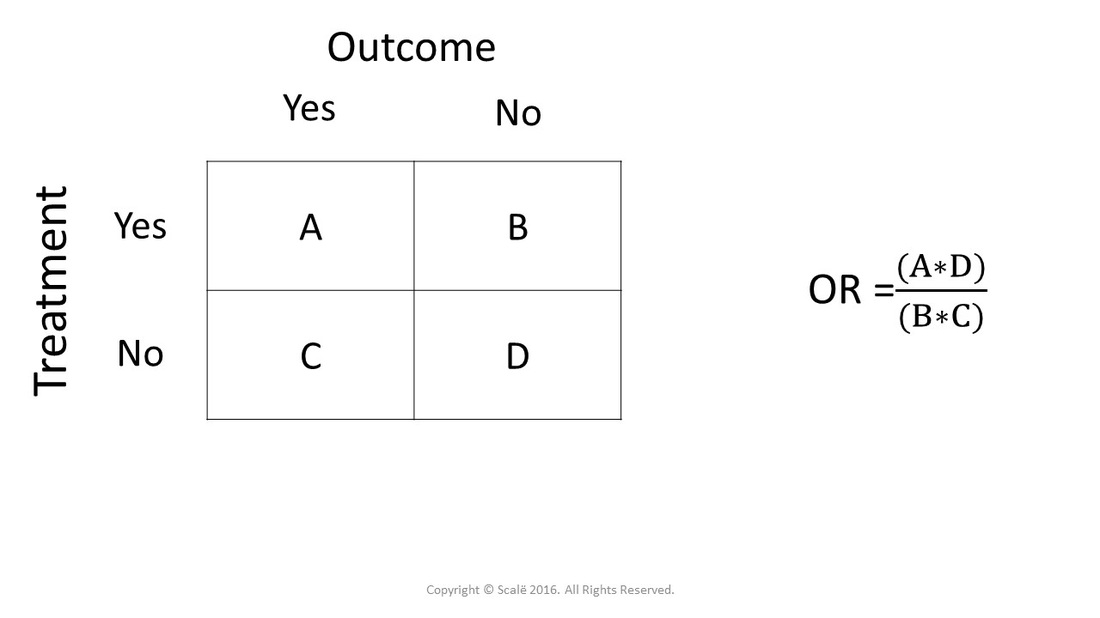
The picture below presents the basic set-up of a 2x2 table for a Chi-square analysis and the odds ratio formula. With the way the table is structured, the odds ratio is answering the question for Cell A. The question is "What are the odds of someone receiving the treatment having the outcome versus someone not receiving the treatment?"
The 95% confidence interval that coincides with the odds ratio is the inference being yielded from a Chi-square analysis. The 95% confidence interval dictates the precision (or width) of the odds ratio statistical finding. With larger sample sizes, 95% confidence intervals will narrow, yield more precise inferences. Smaller sample sizes create wide confidence intervals that are hard to interpret.
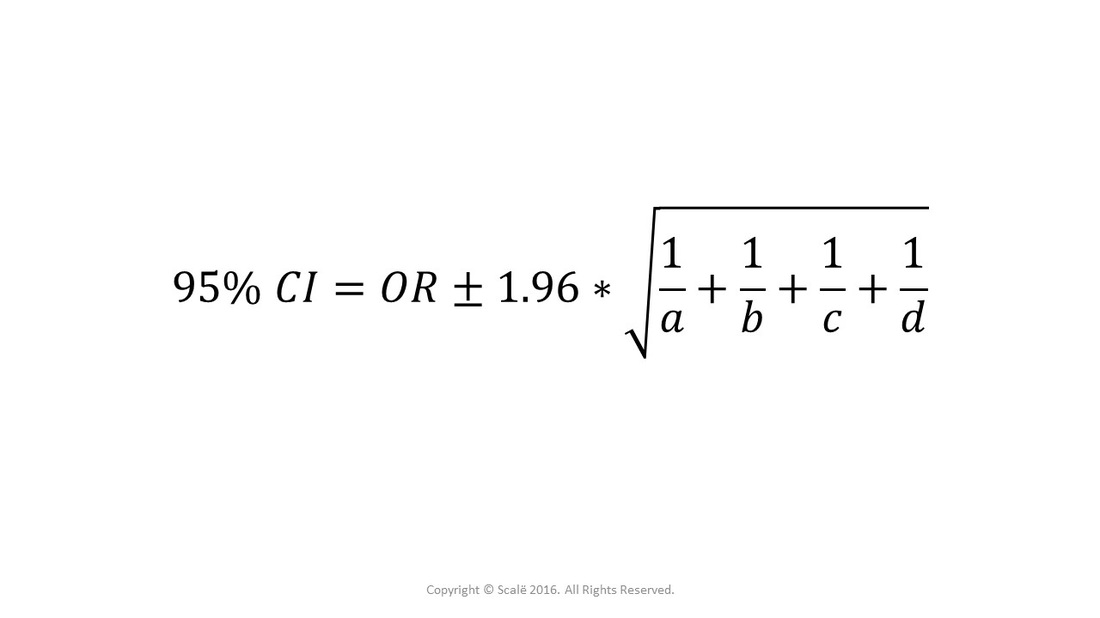
Here is the formula for calculating the 95% confidence interval of an unadjusted odds ratio.
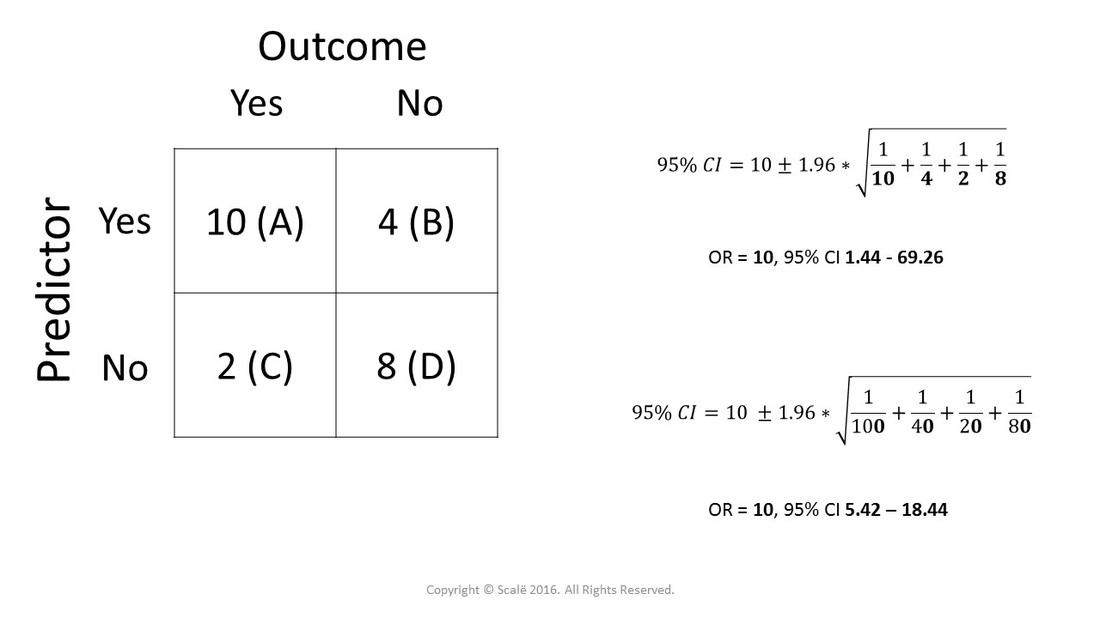
Based on the example below, one can see that the width of the confidence interval is 100% dependent upon the sample size used in the analysis. All that was done in the second formula was to add a "0" to each value in the 2x2 table. The odds ratio was exactly the same, but the confidence interval was much more constricted and precise due to the larger sample size.
The effect of sample size on 95% confidence intervals
The steps for conducting a Chi-square in SPSS
1. The data is entered in a between-subjects fashion. The control group is codified as "0" and the treatment group is codified as "1." Absence of the outcome is codified as "0" and presence of the outcome is codified as "1."
2. Click Analyze.
3. Drag the cursor over the Descriptive Statistics drop-down menu.
4. Click Crosstabs.
5. Click on the dichotomous categorical predictor variable to highlight it.
6. Click on the arrow button to move the variable into the Row(s): box.
7. Click on the dichotomous categorical outcome variable to highlight it.
8. Click on the arrow button to move the variable into the Column(s): box.
9. Click on the Statistics button.
10. Click on the Chi-square box to select it.
11. Click on the Risk box to select it.
12. Click Continue.
13. Click OK.
The steps for interpreting the SPSS output for a Chi-square
1. Look at the Crosstabulation table. This table shows the dispersal of the predictor variable across levels of the outcome variable.
2. Interpret the Pearson Chi-Square p-value.
3. If researchers have a significant p-value, then they can interpret the first row in the Risk Estimate table. The unadjusted odds ratio is presented in the Value column and the lower and upper limits of the 95% confidence interval wrapped around the odds ratio.
If the p-value is significant and the odds ratio is above 1.0 along with the confidence interval, then the treatment group is MORE LIKELY to have the outcome.
If the p-value is significant and the odds ratio is below 1.0 along with the confidence interval, then the treatment group is LESS LIKELY to have the outcome.
If the p-value is non-significant, then researchers will see that the 95% confidence interval crosses over 1.0. They can report the odds ratio or p-value as needed.
When to use Fisher's Exact Test rather than Chi-square
Fisher's Exact Test is used when there are less than five (5) observations in one of the cells of the 2x2 table. This is known as the Chi-square assumption. Fisher's Exact Test is also used when there are less than 20 observations being tested.
Click on the Fisher's Exact Test button if there is a violation of the above assumption or there are less than 20 observations.
Click on the Fisher's Exact Test button if there is a violation of the above assumption or there are less than 20 observations.
Click on the Download Database and Download Data Dictionary buttons for a configured database and data dictionary for chi-square. Click on the Validation of Statistical Findings button to learn more about bootstrap, split-group, and jack-knife validation methods.
Statistician For Hire
DO YOU NEED TO HIRE A STATISTICIAN?
Eric Heidel, Ph.D. will provide statistical consulting for your research study at $100/hour. Secure checkout is available with PayPal, Stripe, Venmo, and Zelle.
- Statistical Analysis
- Sample Size Calculations
- Diagnostic Testing and Epidemiological Calculations
- Psychometrics


