Fisher's Exact Test
Fisher's Exact test is used when the chi-square assumption is violated
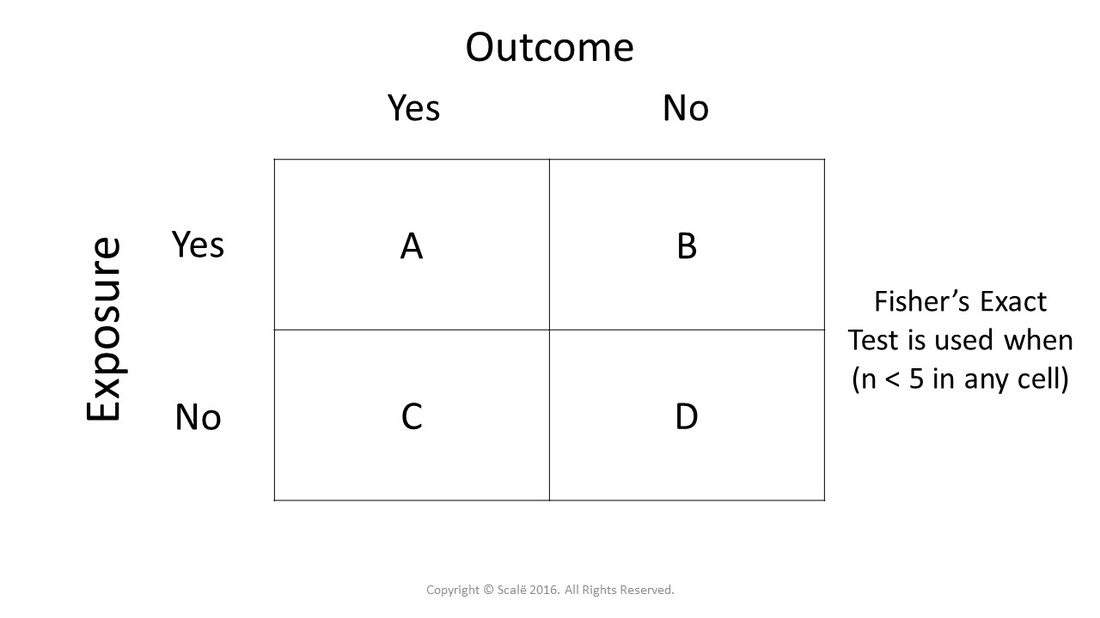
Fisher's Exact Test is very similar to the chi-square test in that researchers are testing the association or relationship between two dichotomous categorical variables. The primary difference between the two is that Fisher's Exact Test is used ONLY when one of the four cells of a 2x2 table has less than five observations.
Fisher's Exact Test is often used with small sample sizes (n < 20) and when researching rare outcomes. The p-value is not interpreted with Fisher's Exact Test. The unadjusted odds ratio with 95% confidence interval is used instead. The width of the 95% confidence interval will be extremely wide due to the limited number of observations in one of the four cells.
SPSS automatically calculates a Fisher's Exact Test p-value when conducting chi-square analysis.
Fisher's Exact Test is used when any cell of the 2x2 table has less than five observations.
The steps for conducting a Fisher's Exact Test in SPSS
1. The data is entered in a between-subjects fashion. The control group is codified as "0" and the treatment group is codified as "1." Absence of the outcome is codified as "0" and presence of the outcome is codified as "1."
2. Click Analyze.
3. Drag the cursor over the Descriptive Statistics drop-down menu.
4. Click Crosstabs.
5. Click on the dichotomous categorical predictor variable to highlight it.
6. Click on the arrow button to move the variable into the Row(s): box.
7. Click on the dichotomous categorical outcome variable to highlight it.
8. Click on the arrow button to move the variable into the Column(s): box.
9. Click on the Statistics button.
10. Click on the Chi-square box to select it.
11. Click on the Risk box to select it.
12. Click Continue.
13. Click OK.
The steps for interpreting the SPSS output for Fisher's Exact Test
1. Look at the Crosstabulation table. This table shows the dispersal of the predictor variable across levels of the outcome variable.
2. Interpret the Fisher's Exact Test Exact Sig. (2-sided) p-value.
3. If researchers have a significant p-value, then they can interpret the first row in the Risk Estimate table. The unadjusted odds ratio is presented in the Value column and the lower and upper limits of the 95% confidence interval wrapped around the odds ratio.
If the p-value is significant and the odds ratio is above 1.0 along with the confidence interval, then the treatment group is MORE LIKELY to have the outcome.
If the p-value is significant and the odds ratio is below 1.0 along with the confidence interval, then the treatment group is LESS LIKELY to have the outcome.
If the p-value is non-significant, then researchers will see that the 95% confidence interval crosses over 1.0. They can report the odds ratio or p-value as needed.
Click on the Download Database and Download Data Dictionary buttons for a configured database and data dictionary for Fisher's Exact test. Click on the Validation of Statistical Findings button to learn more about bootstrap, split-group, and jack-knife validation methods.

Hire A Statistician
DO YOU NEED TO HIRE A STATISTICIAN?
Eric Heidel, Ph.D., PStat will provide you with statistical consultation services for your research project at $100/hour. Secure checkout is available with Stripe, Venmo, Zelle, or PayPal.
- Statistical Analysis on any kind of project
- Dissertation and Thesis Projects
- DNP Capstone Projects
- Clinical Trials
- Analysis of Survey Data