Sample size for Pearson's r
Effect size is the hypothesized association between two continuous variables
In order to run an a priori sample size calculation for a Pearson's r correlation, researchers will need to seek out evidence that provides the proposed correlation between the two variables of interest. The correlation between these two variables constitutes the evidence-based measure of effect size. Use the values reported in articles that are theoretically or conceptually similar to the study of interest and enter them into the sample size calculation for a Pearson's r correlation.
A good rule of thumb is to use the effect size criteria identified by Cohen (1988).
Small effect size = .10
Moderate effect size = .30
Large effect size = .50
A good rule of thumb is to use the effect size criteria identified by Cohen (1988).
Small effect size = .10
Moderate effect size = .30
Large effect size = .50
The steps for calculating sample size for a Pearson's r in G*Power
1. Start up G*Power.
2. Under the Test family drop-down menu, select Exact.
3. Under the Statistical test drop-down menu, select Correlation: Bivariate normal model.
4. Under the Type of power analysis drop-down menu, select A priori: Compute required sample size - given alpha, power, and effect size.
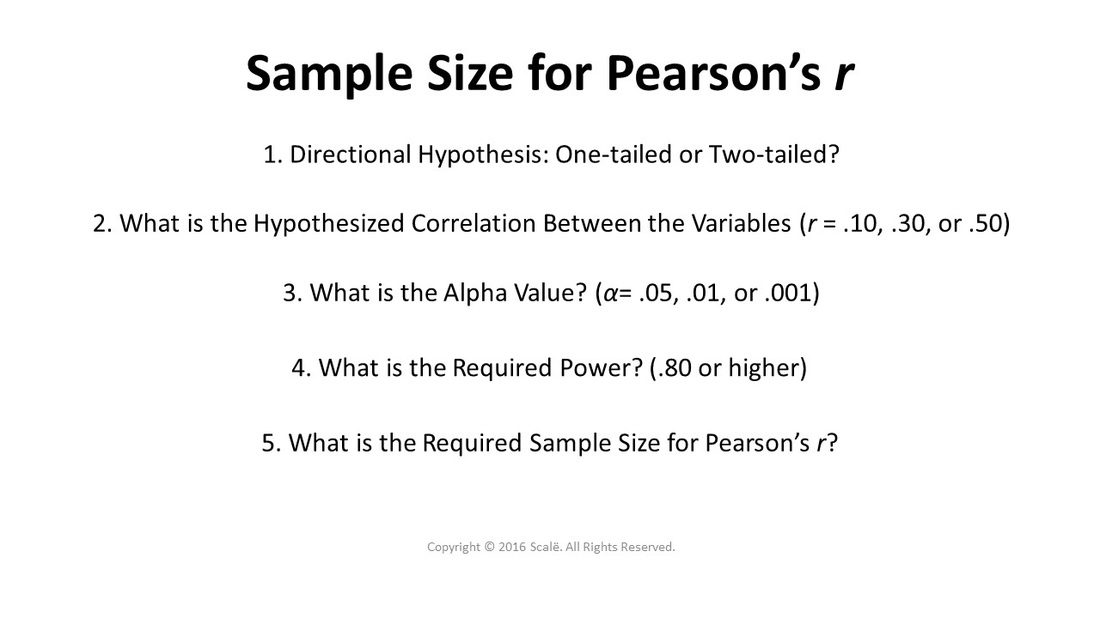
5. In the Tail(s) drop down menu, select One if researchers have a definitive and literature-based reason for believing that the correlation travels in a certain direction (either positive or negative). Select Two if researchers are unsure whether the correlation will be positive or negative.
6. In the Correlation p H1 box, enter one of the following values:
Enter ".10" if researchers believe there will be a small treatment effect.
Enter ".30" if researchers believe there will be a moderate treatment effect.
Enter ".50" if researchers believe there will be a large treatment effect.
7. Leave the alpha value at 0.05, unless researchers want to change the alpha value according to the current empirical or clinical context.
8. Enter .80 into the Power (1-beta err prob) box, unless researchers want to change the power according to the current empirical or clinical context.
9. Leave the Correlation p H0 box at 0.
10. Click Calculate.
2. Under the Test family drop-down menu, select Exact.
3. Under the Statistical test drop-down menu, select Correlation: Bivariate normal model.
4. Under the Type of power analysis drop-down menu, select A priori: Compute required sample size - given alpha, power, and effect size.
5. In the Tail(s) drop down menu, select One if researchers have a definitive and literature-based reason for believing that the correlation travels in a certain direction (either positive or negative). Select Two if researchers are unsure whether the correlation will be positive or negative.
6. In the Correlation p H1 box, enter one of the following values:
Enter ".10" if researchers believe there will be a small treatment effect.
Enter ".30" if researchers believe there will be a moderate treatment effect.
Enter ".50" if researchers believe there will be a large treatment effect.
7. Leave the alpha value at 0.05, unless researchers want to change the alpha value according to the current empirical or clinical context.
8. Enter .80 into the Power (1-beta err prob) box, unless researchers want to change the power according to the current empirical or clinical context.
9. Leave the Correlation p H0 box at 0.
10. Click Calculate.
Click on the Statistics button to continue.

Statistician For Hire
DO YOU NEED TO HIRE A STATISTICIAN?
Eric Heidel, Ph.D. will provide statistical consulting for your research study at $100/hour. Secure checkout is available with PayPal, Stripe, Venmo, and Zelle.
- Statistical Analysis
- Sample Size Calculations
- Diagnostic Testing and Epidemiological Calculations
- Psychometrics
Cohen, J. (1988). Statistical Power Analysis for the Behavioral Sciences (2nd ed.). New Jersey: Lawrence Erlbaum Associates.