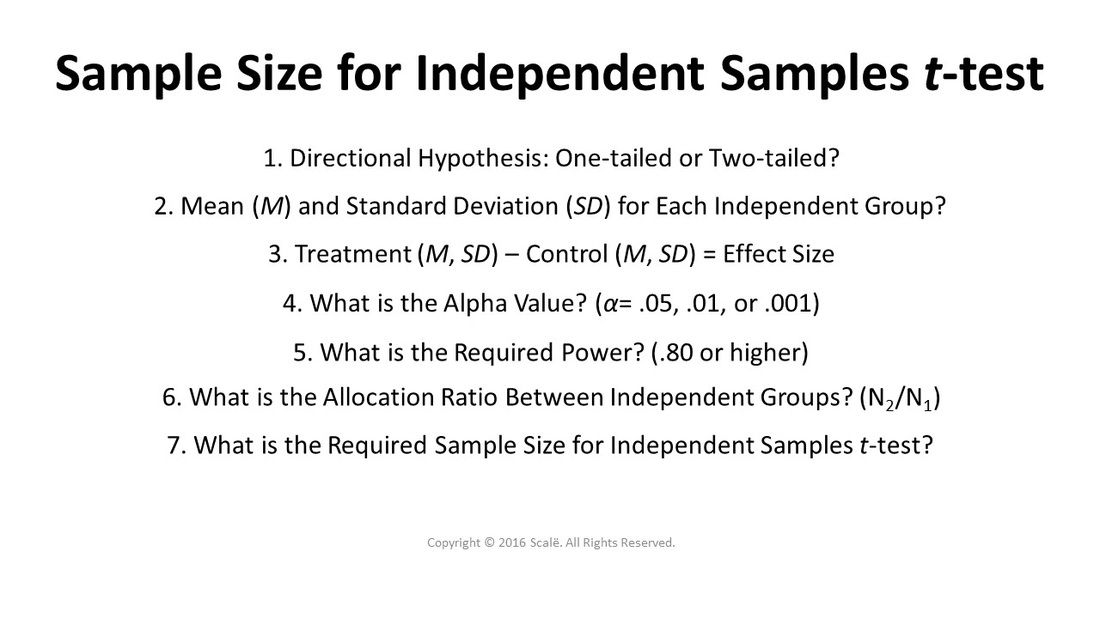
In order to run an a priori sample size calculation for an independent samples t-test, researchers will need to seek out evidence that provides the means and standard deviations of the outcome in the treatment group and the control group. The absolute difference between the two mean values and their respective variances dictates the evidence-based measure of effect. Seek out articles that are similar in terms of research question and methods and use the reported values in the articles as an evidence-based measure of effect when calculating sample size for an independent samples t-test.
A good rule of thumb is to overestimate the variance of the effect size when calculating the sample size for an independent samples t-test. Researchers do this because it forces them to have to collect more observations of the outcome, which in turn leads to more precise and accurate measures of effect.
For example, let's say that researchers find quality evidence that people in the treatment group sleep an average of 7.5 hours a night with a standard deviation of 1.5 and people in the control group sleep an average of 6.7 hours a night with a standard deviation of 2.1. There is an evidenced-based measure of effect of 0.8 hours (7.5 - 6.7 = 0.8). Researchers could enter these values into G*Power and know exactly how many observations of the outcome they would need to collect in order to detect that 0.8 hour treatment effect.
1. Start up G*Power.
2. Under the Test family drop-down menu, select t tests.
3. Under the Statistical test drop-down menu, select Means: Difference between two independent means (two groups).
4. Under the Type of power analysis drop-down menu, select A priori: Compute required sample size - given alpha, power, and effect size.
5.If there is a directional hypothesis, under the Tail(s) drop-down menu, select One.
6. If there is a non-directional hypothesis, under the Tail(s) drop-down menu, select Two.
7. Click the Determine button.
8. Enter the mean for the treatment group into the Mean group 1 box. Example: "7.5"
9. Enter the mean for the control group into the Mean group 2 box. Example: "6.7"
10. Enter the standard deviation associated with the mean of the treatment group into the SD insert group 1 box. Example: "1.5"
11. Enter the standard deviation associated with the mean of the control group into the SD insert group2 box. Example: "2.1"
12. Click Calculate.
13. Click Calculate and transfer to main window.
14. Leave the alpha value at 0.05, unless researchers want to change the alpha value according to the current empirical or clinical context.
15. Enter ".80" into the Power (1-beta err prob) box, unless researchers want to change the power according to the current empirical or clinical context.
16. If researchers have exactly equally sized groups, then leave the Allocation ratio N2/N1 value at "1." If researchers have unequally sized groups, then divide the sample size of the treatment group by the sample size of the control group and enter that value into the box.
17. Click Calculate.
Based on the values from the example and the steps above, a two-tailed test with 0.8 hour effect and alpha of .05 and power of .80 with equally sized groups yields a sample size of 166 with 83 participants in each group to detect the effect.
Click on the Statistics button to continue.