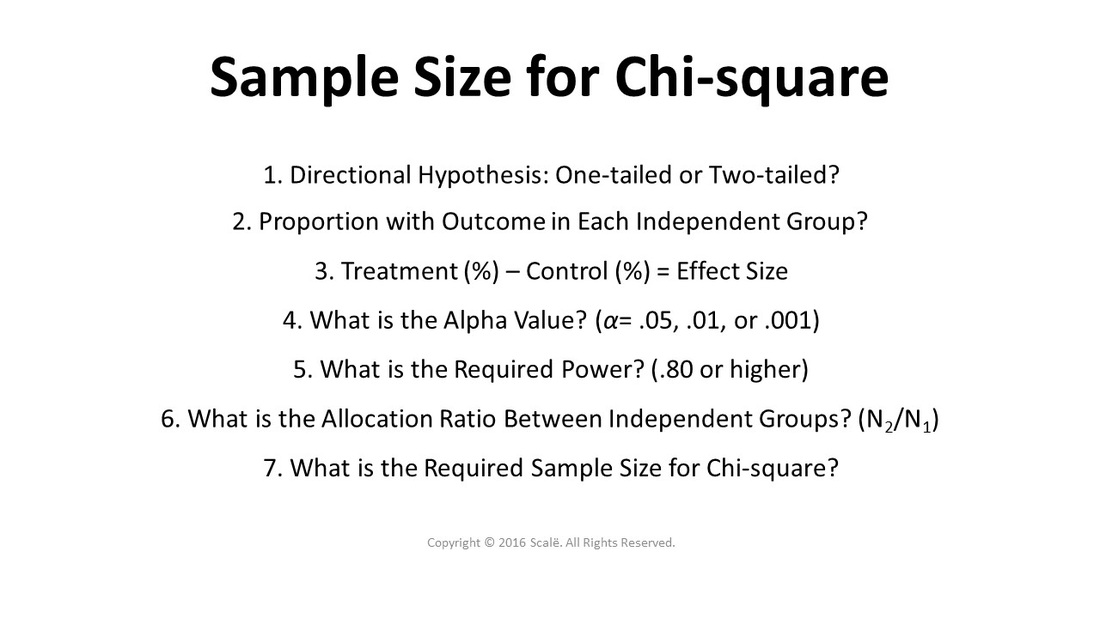
Sample size for Chi-square
Effect size is the difference in proportions between two groups on the outcome
In order to conduct an a priori sample size calculation for a chi-square, researchers will need to seek out evidence that provides the proportion of people in the treatment group and the control group that had the categorical outcome of interest. The absolute difference between these two proportions is the effect size.
When running a sample size calculation for chi-square, it is best to use an evidence-based measure of effect size yielded from a published study that is conceptually or theoretically similar to the study being conducted. Use the reported proportions in a published article to calculate the sample size needed for a chi-square analysis.
For example, let's say that researchers find quality evidence that 85% of people that receive a treatment will have a positive outcome and 70% of people that do not receive the treatment will have a positive outcome. They now have an evidenced-based measure of effect of 15% (85%-70% = 15%). Researchers could enter these values into G*Power and know exactly how many observations of the outcome they would need to collect in order to detect the 15% treatment effect.
The steps for calculating sample size for a chi-square in G*Power
1. Start up G*Power.
2. Under the Test family drop-down menu, select z test.
3. Under the Statistical test drop-down menu, select Proportions: Difference between two independent proportions.
4. Under the Type of power analysis drop-down menu, select A priori: Compute required sample size - given alpha, power, and effect size.
5. If there is a directional hypothesis, under the Tail(s) drop-down menu, select One.
6. If there is a non-directional hypothesis, under the Tail(s) drop-down menu, select Two.
7. In the Proportion p2 box, enter the proportion of people in the treatment group that will have the outcome. Example: ".85"
8. In the Proportion p1 box, enter the proportion of people in the control group that will have the outcome. Example: ".70"
9. Leave the alpha value at 0.05, unless researchers want to change the alpha value according to the current empirical or clinical context.
10. Enter ".80" into the Power (1-beta err prob) box, unless researchers want to change the power according to the current empirical or clinical context.
11. If researchers have exactly equally sized groups, then leave the Allocation ratio N2/N1 value at "1." If researchers have unequally sized groups, then divide the sample size of the treatment group by the sample size of the control group and enter that value into the box.
Using the proportions from the example and the 11 steps above, a two-tailed 15% effect size at an alpha of .05 and 80% with equal sample sizes yields a sample size of 242 with 121 participants in each group to be able to detect that effect.
Click on the Statistics button to continue.
Hire A Statistician
DO YOU NEED TO HIRE A STATISTICIAN?
Eric Heidel, Ph.D., PStat will provide you with statistical consultation services for your research project at $100/hour. Secure checkout is available with Stripe, Venmo, Zelle, or PayPal.
- Statistical Analysis on any kind of project
- Dissertation and Thesis Projects
- DNP Capstone Projects
- Clinical Trials
- Analysis of Survey Data

