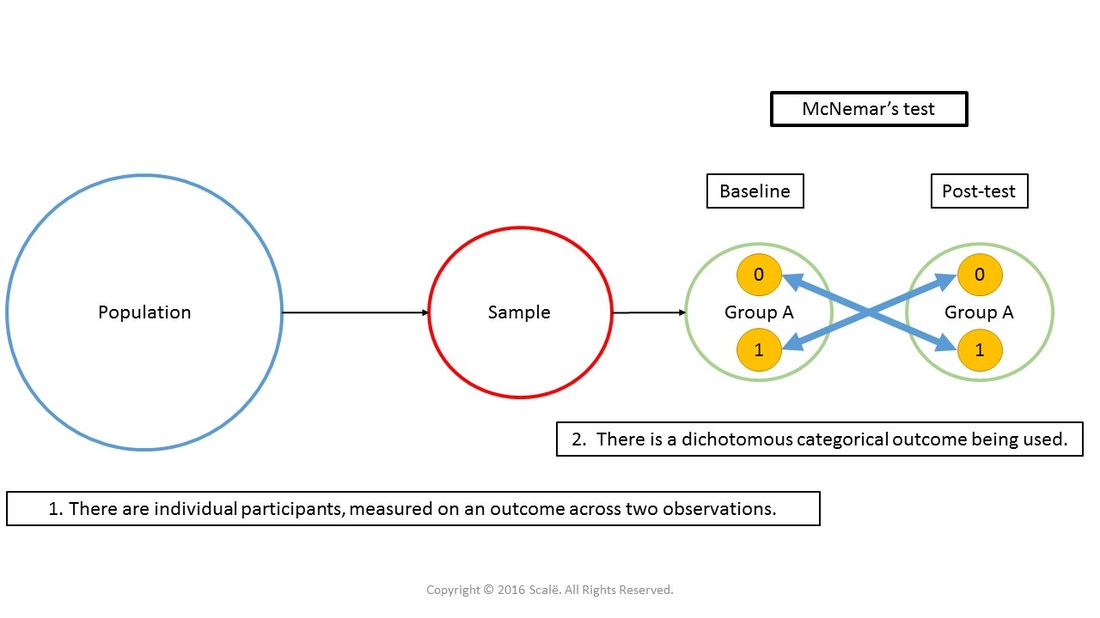
McNemar's test is used for within-subject designs where the change of a dichotomous categorical baseline measure is assessed across two time points or two within-subjects observations. With McNemar's test, the proportion of individuals that switch from one level to the other across time dictates statistical significance. Relative risk for change can be calculated as well. Report the p-value associated with the statistical inference and the relative risk with 95% confidence interval for purposes of interpreting McNemar's test.
This figure depicts the use of a McNemar's test. There is only one group being observed. The individual participants in the group have both a baseline and a "post" observation of a dichotomous categorical outcome (yes/no). McNemar's test is used to assess the amount of change that occurs in a dichotomous categorical outcome across two within-subjects observations or two time points.

1. The data is entered in a within-subjects fashion.
2. Click Analyze.
3. Drag the cursor over the Nonparametric Tests drop-down menu.
4. Drag the cursor over the Legacy Dialogs drop-down menu.
5. Click 2 Related Samples.
6. Click on the first observation of the dichotomous categorical outcome.
7. Click on the arrow button to move the first observation of the outcome variable into the Test Pairs box under the Variable1 column.
8. Click on the second observation of the dichotomous categorical outcome.
9. Click on the arrow button to move the second observation of the outcome variable into the Test Pairs box under the Variable2 column.
10. Click on the Wilcoxon box to deselect it.
11. Click on the McNemar box to select it.
12. Click OK.
1. In the Test Statistics table, look at the p-value associated with Exact Sig. (2-tailed) row. This is the p-value that is interpreted.
If it is LESS THAN .05, then researchers have evidence of a statistically significant effect in the dichotomous categorical outcome across time or within-subjects.
If the p-value is MORE THAN .05, then researchers have evidence that there is NOT a statistically significant effect in the dichotomous categorical outcome across time or within-subjects.
Click on the Download Database and Download Data Dictionary buttons for a configured database and data dictionary for McNemar's test. Click on the Adjusting for Multiple Comparisons button to learn more about Bonferroni, Tukey's HSD, and Scheffe's test. Click on the Validation of Statistical Findings button to learn more about bootstrap, split-group, and jack-knife validation methods.