MANOVA
Account for increased Type I error when testing multiple hypotheses
The MANOVA is often employed to account for what is called "increased experimentwise error rates" when testing multiple hypotheses concurrently. Essentially, with each mutually exclusive bivariate analysis between the categorical predictor variable and an outcome, the chances of committing a Type I error increase substantially. If the statistical assumptions of a MANOVA can be met, it is a much more powerful inferential statistic that can yield both main and interactional effects while controlling for increased experimentwise error rates. MANOVA can yield main effects, interaction effects, and pairwise differences.
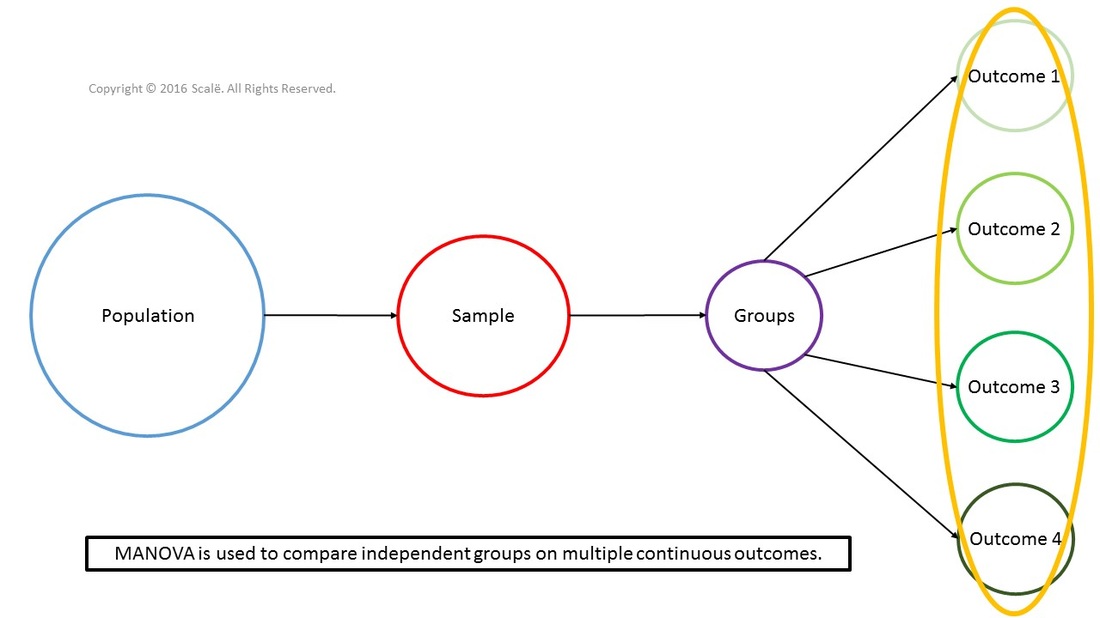
The figure below depicts the use of MANOVA. Independent groups are being compared on several continuous outcomes at the same time. Using MANOVA decreases Type I error.
The steps for conducting MANOVA in SPSS
1. The data is entered in a between-subjects fashion.
2. Click Analyze.
3. Drag the cursor over the General Linear Model drop-down menu.
4. Click Multivariate.
5. Click on the first continuous outcome variable to highlight it.
6. Click on the arrow to move the variable into the Dependent Variables: box.
7. Repeated Steps 5 and 6 until all of the continuous outcome variables are in the Dependent Variables: box.
8. Click on the categorical predictor variable that represents independent groups or levels.
9. Click on the arrow to move the variable into the Fixed Factor(s): box.
10. Click on the Options button.
11. Click on the categorical predictor variable in the Factor(s) and Factor Interactions: box to highlight it.
12. Click on the arrow to move the variable into the Display Means for: box.
13. Click on the Compare main effects box to select it.
14. In the Display table, click on the Descriptive statistics, Estimates of effect size, Observed power, and Homogeneity tests boxes to select them.
15. Click Continue.
16. Click OK.
The steps for interpreting the SPSS output for MANOVA
1. Look in the Box's Test of Equality of Covariance Matrices, in the Sig. row. This is the p-value that is interpreted.
If it is LESS THAN .05, then researchers have violated the assumption of homogeneity of covariance and should not interpret the outputs further.
If it is MORE THAN .05, then researchers can continue with the analysis and have met the assumption of homogeneity of covariance.
2. Look in the Levene's Test of Equality of Error Variances table, under the Sig. column, for each outcome variable that has a p-value testing the assumption of homogeneity of variance.
If it is LESS THAN .05, then researchers have violated the assumption and should not continue with the analysis.
If it is MORE THAN .05, then researchers can continue with the analysis and interpretation.
3. Look in the Multivariate Tests table, under the Sig. column, for the row that has the categorical predictor variable's name and Pillai's Trace. This is the p-value that is interpreted.
If it is LESS THAN .05, then researchers have evidence of a significant main effect.
If it is MORE THAN .05, then researchers do not have evidence of a significant effect. No further interpretation is needed. Report the p-value.
4. Look in the Tests of Between-Subjects Effects table, under the Sig. column, for the row denoting the categorical predictor variable. These are the p-values that are interpreted for each individual outcome variable. These should be interpreted if there was a significant main effect in the Multivariate Tests table.
If a p-value for one of the outcome variables is LESS THAN .05, then there was a significant main effect among the independent groups or levels of that outcome. If researchers find this significant main effect, they need to further run post hoc analyses to explain the effect.
If a p-value for one of the outcome variables is MORE THAN .05, then there was NOT significant main effect among the independent groups or levels of that outcome.
5. Scroll down to the Estimated Marginal Means section of the output. Look in the Estimates table. These are the means and standard errors of the outcome for each group or level of the categorical variable.
6. Look in the Pairwise Comparisons table, under the Sig. column. These are the post hoc p-values that are interpreted.
If a p-value is LESS THAN .05, then there was a significant difference between the independent groups or levels of the categorical predictor variable.
If a p-value is MORE THAN .05, then there was NOT a significant difference between the independent groups or levels of the categorical predictor variable.
Click on the Download Database and Download Data Dictionary buttons for a configured database and data dicationary for MANOVA. Click on the Validation of Statistical Findings button to learn more about bootstrap, split-group, and jack-knife validation methods.
Hire A Statistician
DO YOU NEED TO HIRE A STATISTICIAN?
Eric Heidel, Ph.D., PStat will provide you with statistical consultation services for your research project at $100/hour. Secure checkout is available with Stripe, Venmo, Zelle, or PayPal.
- Statistical Analysis on any kind of project
- Dissertation and Thesis Projects
- DNP Capstone Projects
- Clinical Trials
- Analysis of Survey Data

