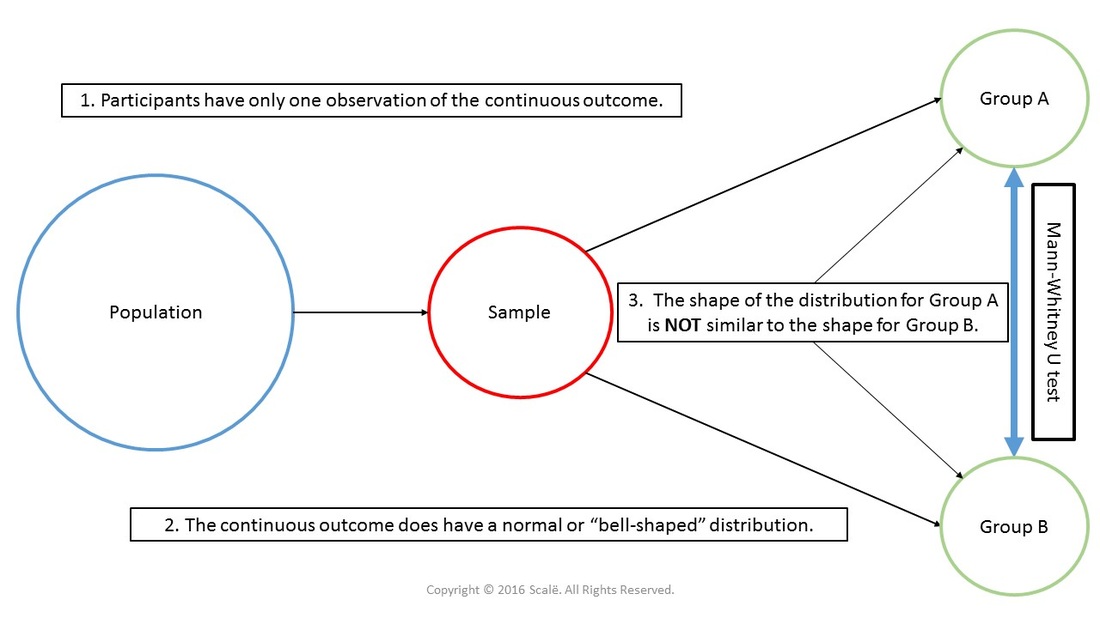
The Mann-Whitney U test is the non-parametric equivalent of an independent samples t-test. Mann-Whitney U is used when you are comparing two independent groups on a continuous outcome, but the assumption of homogeneity of variance between the groups is violated. The Mann-Whitney U test is robust to violations of the assumption of homogeneity of variance. Researchers will need to report medians and interquartile ranges instead of means and standard deviations when using a Mann-Whitney U test.
After meeting the assumptions of independence of observations and normality, the next step in conducting an independent samples t-test is to test the assumption of homogeneity of variance using Levene's test. If the assumption of homogeneity is not met, then researchers can use the Mann-Whitney U test to test for significant differences between two independent groups.

1. The data is entered in a between-subjects fashion.
2. Click Analyze.
3. Drag the cursor over the Nonparametric Tests drop-down menu.
4. Drag the cursor over the Legacy Dialogs drop-down menu.
5. Click 2 Independent Samples.
6. Click on the continuous outcome variable to highlight it.
7. Click on the arrow button to move the outcome variable into the Test Variable List: box.
8. Click on the "grouping" variable to highlight it and click on the arrow to move the "grouping" variable into the Grouping Variable: box.
9. Click on the Define Groups button.
10. Enter the categorical value for the first independent group into the Group 1: box. Example: "0"
11. Enter the categorical value for the second independent group into the Group 2: box. Example : "1"
12. Click Continue.
13. Click OK.
1. In the Test Statistics table, look at the p-value associated with Asymp. Sig. (2-tailed) row. This is the p-value that will be interpreted.
If it is LESS THAN .05, then researchers have evidence of a statistically significant difference in the continuous outcome variable between the two independent groups.
If the p-value is MORE THAN .05, then researchers have evidence that there is NOT a statistically significant difference in the continuous outcome variable between the two independent groups.
2. Medians and interquartile ranges are reported for each independent group when using the Mann-Whitney U test.
Click on the Download Database and Download Data Dictionary buttons for a configured database and data dictionary for a Mann-Whitney U. Click on the Adjusting for Multiple Comparisons button to learn more about Bonferroni, Tukey's HSD, and Scheffe's test. Click on the Validation of Statistical Findings button to learn more about bootstrap, split-group, and jack-knife validation methods.