Independent samples t-test
Compare two independent groups on a continuous outcome after meeting statistical assumptions
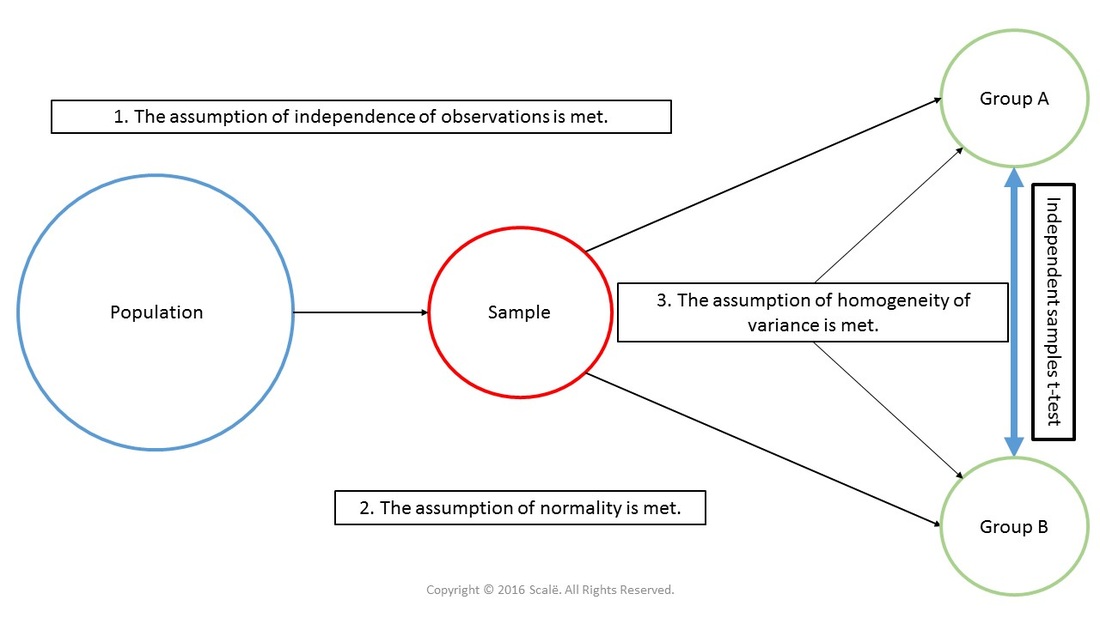
Independent samples t-test is used to compare two independent groups on a continuous outcome. The assumption of normality and the assumption of homogeneity of variance must be met before running an independent samples t-test. The p-value for an independent samples t-test is always interpreted within the context of the means and standard deviations of the two groups.
Here is a diagram depicting the use of an independent samples t-test. The statistical assumptions of independence of observations, normality, and homogeneity of variance have to be met before an independent samples t-test can be used. There are two independent groups being compared on a continuous outcome.
The steps for conducting an independent samples t-test in SPSS
1. Click Analyze.
2. Drag the cursor over the Compare Means drop-down menu.
3. Click on Independent-Samples T Test.
4. Click on the continuous outcome variable to highlight it.
5. Click on the arrow to move the outcome variable into the Test Variable(s): box.
6. Click on the "grouping" variable to highlight it.
7. Click on the arrow to move the "grouping" variable into the Grouping Variable: box.
8. Click on the Define Groups button.
9. Enter the categorical value for the first independent group into the Group 1: box. Example: "0"
10. Enter the categorical value for the second independent group into the Group 2: box. Example: "1"
12. Click Continue.
13. Click OK.
The steps for interpreting the SPSS output for an independent samples t-test
1. In the Group Statistics table, there are several important pieces of information about each independent group in the "grouping" variable including the size of each group (N) and their respective means (Mean) and standard deviations (Std. Deviation). Disregard the Std. Error Mean values for practical purposes.
2. Under the t-test for Equality of Means column heading, look at the p-value under the Sig. (2-tailed) column.
If the p-value is LESS THAN .05, then researchers have a statistically significant difference between the two independent groups on the outcome.
If the p-value is MORE THAN .05, then researchers do NOT have a statistically significant difference between the two independent groups on the outcome.
3. Look back up at the Group Statistics table. The p-value must be interpreted within the context of your means and standard deviations. For example, one would say, "There was a statistically significant difference between 'Group 1' (Mean and standard deviation) and 'Group 2' (Mean and standard deviation), p = .01."
Click on the Download Database and Download Data Dictionary buttons for a pre-configured database and data dictionary for independent samples t-tests. Click on the Adjusting for Multiple Comparisons button to learn more about using Bonferroni, Tukey's HSD, and Scheffe's test. Click on the Validation of Statistical Findings button to learn more about bootstrap, split-group, and jack-knife validation methods.
Statistician For Hire
DO YOU NEED TO HIRE A STATISTICIAN?
Eric Heidel, Ph.D. will provide statistical consulting for your research study at $100/hour. Secure checkout is available with PayPal, Stripe, Venmo, and Zelle.
- Statistical Analysis
- Sample Size Calculations
- Diagnostic Testing and Epidemiological Calculations
- Psychometrics

