Friedman's ANOVA is used to answer research questions that compare three or more observations on an ordinal outcome across time or within-subjects. Friedman's ANOVA is considered non-parametric because the outcome is not measured at a continuous level. Instead of reporting means and standard deviations, researchers will report the median and interquartile range of each observation when using Friedman's ANOVA.
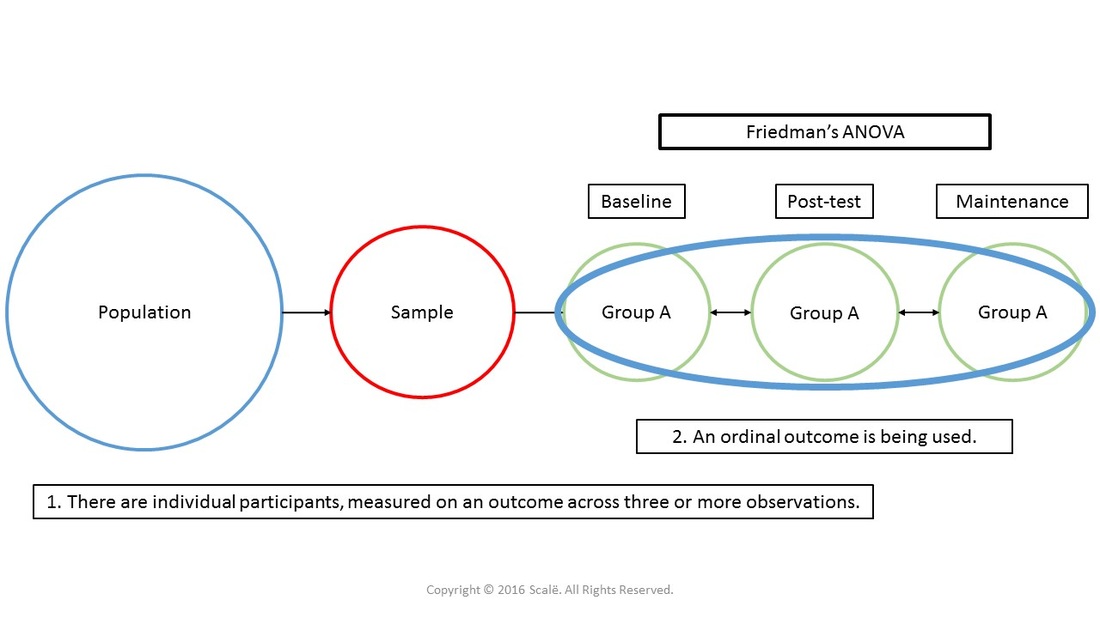
The figure below depicts the use of Friedman's ANOVA. There is only one group being observed. There are three or more observations of an ordinal outcome being assessed.

1. The data is entered in a within-subjects fashion.
2. Click Analyze.
3. Drag the cursor over the Nonparametric Tests drop-down menu.
4. Drag the cursor over the Legacy Dialogs drop-down menu.
5. Click K Related Samples.
6. Click on the first observation of the dichotomous categorical outcome.
7. Click on the arrow button to move the first observation of the dichotomous categorical outcome variable into the Test Variables: box.
8. Click on the second observation of the dichotomous categorical outcome.
9. Click on the arrow button to move the second observation of the dichotomous categorical outcome variable into the Test Variables: box.
10. Click on the third observation of the dichotomous categorical outcome.
11. Click on the arrow button to move the third observation of the dichotomous categorical outcome variable into the Test Variables: box..
12. Click OK.
1. In the Test Statistics table, look at the p-value associated with Asymp. Sig. row. This is the p-value that is interpreted.
If it is LESS THAN .05, then you have evidence of a statistically significant effect in the dichotomous categorical outcome across time or within-subjects.
If the p-value is MORE THAN .05, then you have evidence that there is NOT a statistically significant effect in the dichotomous categorical outcome across time or within-subjects.
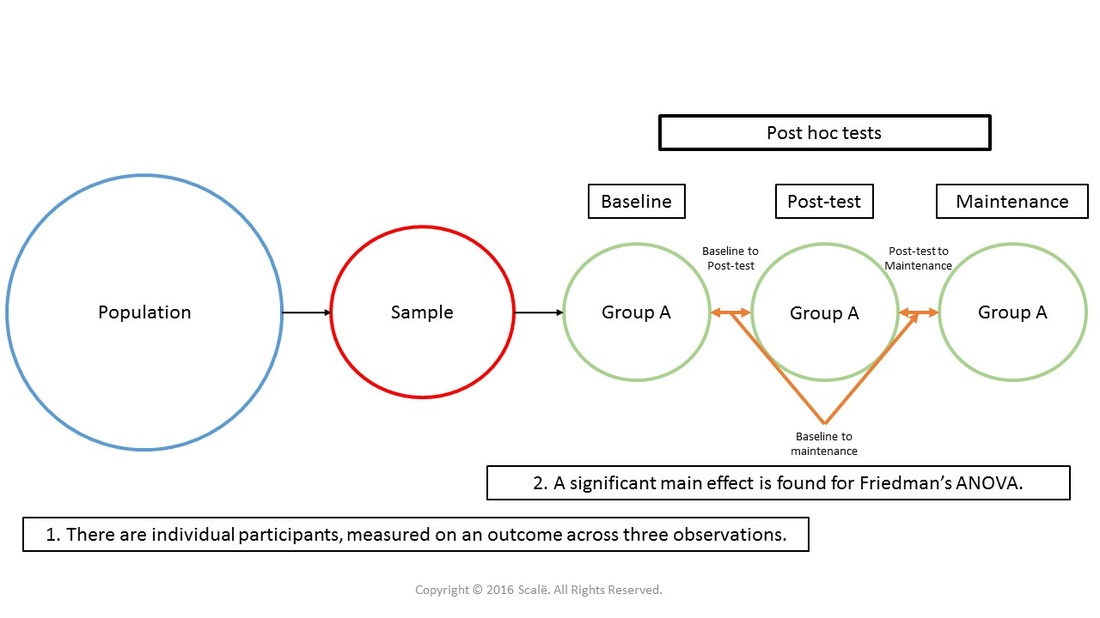
If a significant main effect is found, then subsequent Wilcoxon tests should be employed in a post hoc to establish within-subjects differences. The figure below depicts the use of Wilcoxon tests in a post hoc fashion.

1. The data is entered in a within-subjects fashion.
2. Click Analyze.
3. Drag the cursor over the Nonparametric Tests drop-down menu.
4. Drag the cursor over the Legacy Dialogs drop-down menu.
5. Click 2 Related Samples.
6. Click on the first observation of the ordinal outcome to highlight it.
7. Click on the arrow button to move the first observation of the outcome variable into the Test Pairs box under the Variable1 column, Pair 1.
8. Click on the second observation of the ordinal outcome to highlight it.
9. Click on the arrow button to move the second observation of the outcome variable into the Test Pairs box under the Variable2 column, Pair 1.
10. Click on the second observation of the ordinal outcome to highlight it.
11. Click on the arrow button to move the second observation of the outcome variable into the Test Pairs box under the Variable1 column, Pair 2.
12. Click on the third observation of the ordinal outcome to highlight it.
13. Click on the arrow button to move the third observation of the outcome variable into the Test Pairs box under the Variable2 column, Pair 2.
14. Click on the first observation of the ordinal outcome to highlight it.
15. Click on the arrow button to move the first observation of the outcome variable into the Test Pairs box under the Variable1 column, Pair 3.
16. Click on the third observation of the ordinal outcome to highlight it.
17. Click on the arrow button to move the third observation of the outcome variable into the Test Pairs box under the Variable2 column, Pair 3.
18. Click OK.
1. In the Test Statistics table, look at the p-values associated with each analysis in the Asymp. Sig. (2-tailed) row. These are the p-values that are interpreted.
If a p-value is LESS THAN .05, then researchers have evidence of a statistically significant effect in the ordinal outcome across time or within-subjects between the observations.
If a p-value is MORE THAN .05, then researchers have evidence that there is NOT a statistically significant effect in the ordinal outcome across time or within-subjects between the observations.
Click on the Download Database and Download Data Dictionary buttons for a configured database and data dictionary for Friedman's ANOVA. Click on the Adjusting for Multiple Comparisons button to learn more about Bonferroni, Tukey's HSD, and Scheffe's test. Click on the Validation of Statistical Findings button to learn more about bootstrap, split-group, and jack-knife validation methods.