Cochran's Q
Compare three or more observations of a dichotomous categorical outcome
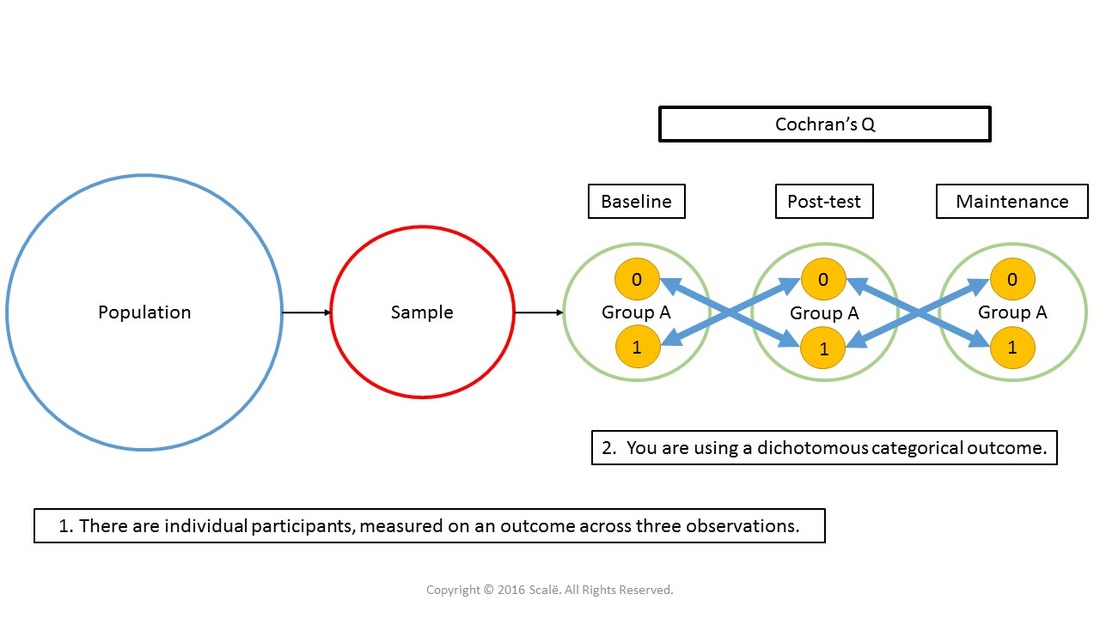
Cochran's Q is used to assess the change in three or more dichotomous categorical outcomes across time or within-subjects. With Cochran's Q, the values are often presented in a cross-tabulation table. Relative risk with 95% confidence intervals can be calculated between each observation to establish the risk of change with both levels of the outcome, across the observations. This will bolster the inferential findings outside of the p-value yielded from the Cochran's Q analysis.
The figure below depicts the use of a Cochran's Q test. There is only one group being observed. Individual participants are assessed on a dichotomous categorical outcome across three or more within-subjects observations or three or more time points.
The steps for conducting a Cochran's Q test in SPSS
1. The data is entered in a within-subjects fashion.
2. Click Analyze.
3. Drag the cursor over the Nonparametric Tests drop-down menu.
4. Drag the cursor over the Legacy Dialogs drop-down menu.
5. Click K Related Samples.
6. Click on the first observation of the dichotomous categorical outcome.
7. Click on the arrow button to move the first observation of the dichotomous categorical outcome variable into the Test Variables: box.
8. Click on the second observation of the dichotomous categorical outcome.
9. Click on the arrow button to move the second observation of the dichotomous categorical outcome variable into the Test Variables: box.
10. Click on the third observation of the dichotomous categorical outcome.
11. Click on the arrow button to move the third observation of the dichotomous categorical outcome variable into the Test Variables: box..
12. Click on the Friedman box to deselect it.
13. Click on the Cochran's Q box to select it.
14. Click OK.
The steps for interpreting the SPSS output for a Cochran's Q test
1. In the Test Statistics table, look at the p-value associated with Asymp. Sig. row. This is the p-value that is interpreted.
If it is LESS THAN .05, then researchers have evidence of a statistically significant effect in the dichotomous categorical outcome across time or within-subjects.
If the p-value is MORE THAN .05, then researchers have evidence that there is NOT a statistically significant effect in the dichotomous categorical outcome across time or within-subjects.
Click on the Download Database and Download Data Dictionary buttons for a pre-configured database and data dictionary for Cochran's Q. Click on the Adjusting for Multiple Comparisons button to learn more about Bonferroni, Tukey's HSD, and Scheffe's test. Click on the Validation of Statistical Findings button to learn more about bootstrap, split-group, and jack-knife validation methods.

Hire A Statistician
DO YOU NEED TO HIRE A STATISTICIAN?
Eric Heidel, Ph.D., PStat will provide you with statistical consultation services for your research project at $100/hour. Secure checkout is available with Stripe, Venmo, Zelle, or PayPal.
- Statistical Analysis on any kind of project
- Dissertation and Thesis Projects
- DNP Capstone Projects
- Clinical Trials
- Analysis of Survey Data